User guides
Instructions for using different versions of the Modbus Master
A practical guide to configuring Modbus slave devices, polling registers, converting raw Modbus values into useful parameters, building JSON payloads, saving data locally, and delivering data through HTTP(s), MQTT, TCP/IP, FTP and FTPS. This guide is based on the current Modbus Master LuCI configuration interface and the supplied backend implementation.
Modbus Master 5.3.3
Modbus version: 5.3.3
Configuration of Modbus Master
To open Modbus master, go to Modbus > Modbus Master
Add Slave Device in Modbus Slave Devices
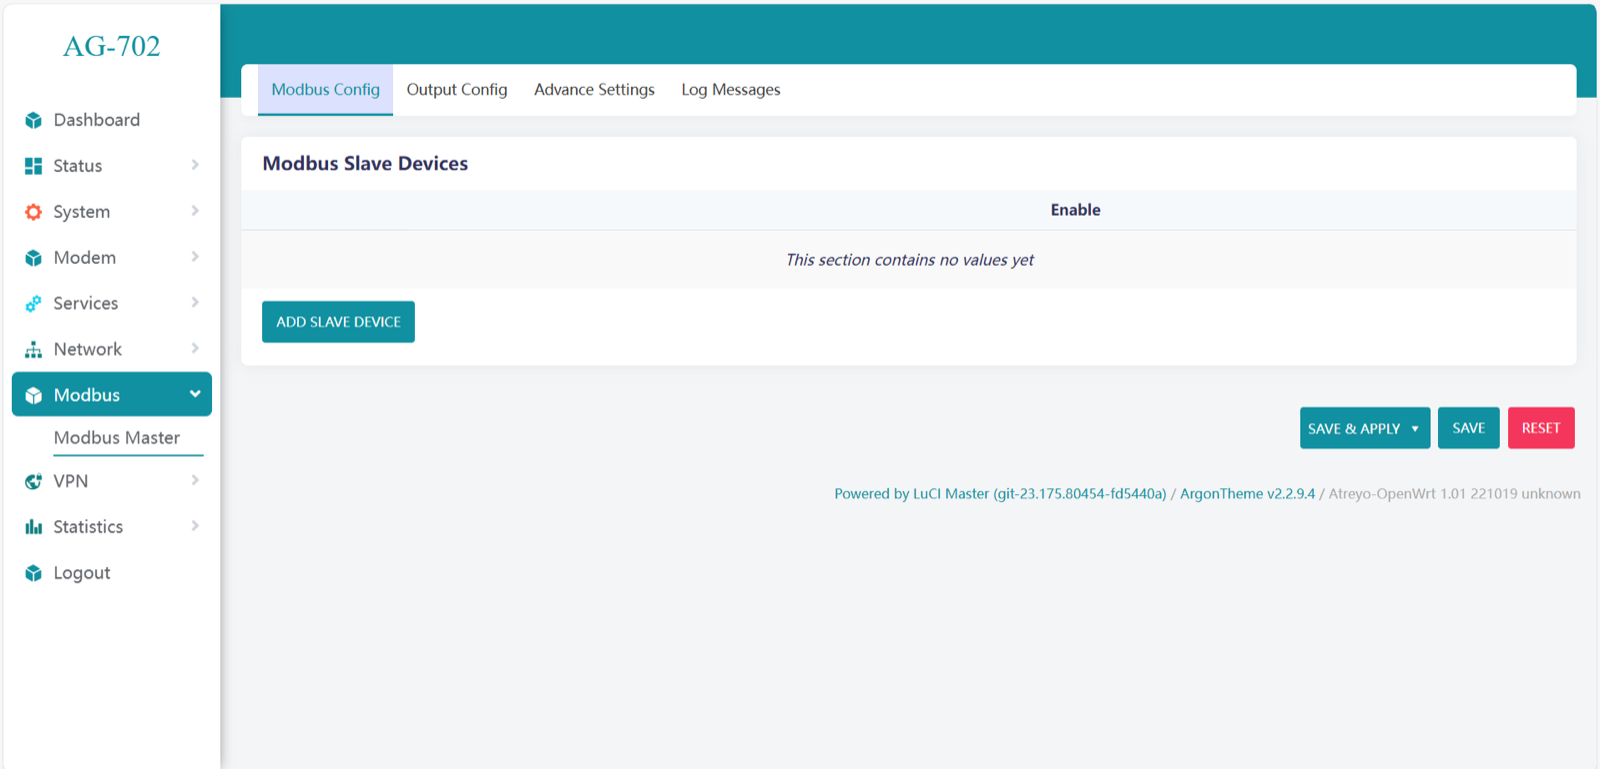
Enter a slave device name of your choice & Select communication protocol.
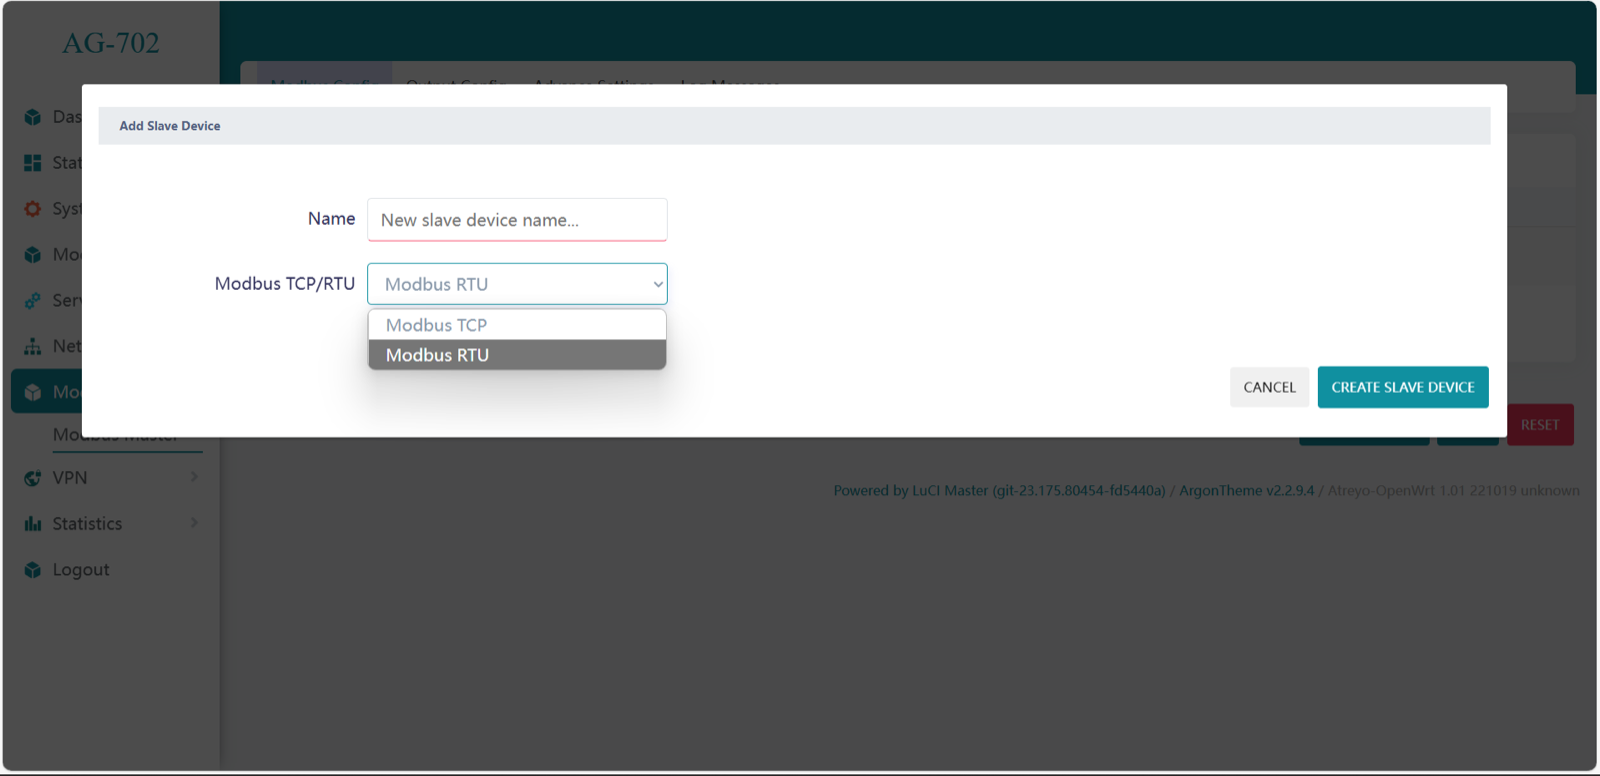
Modbus RTU
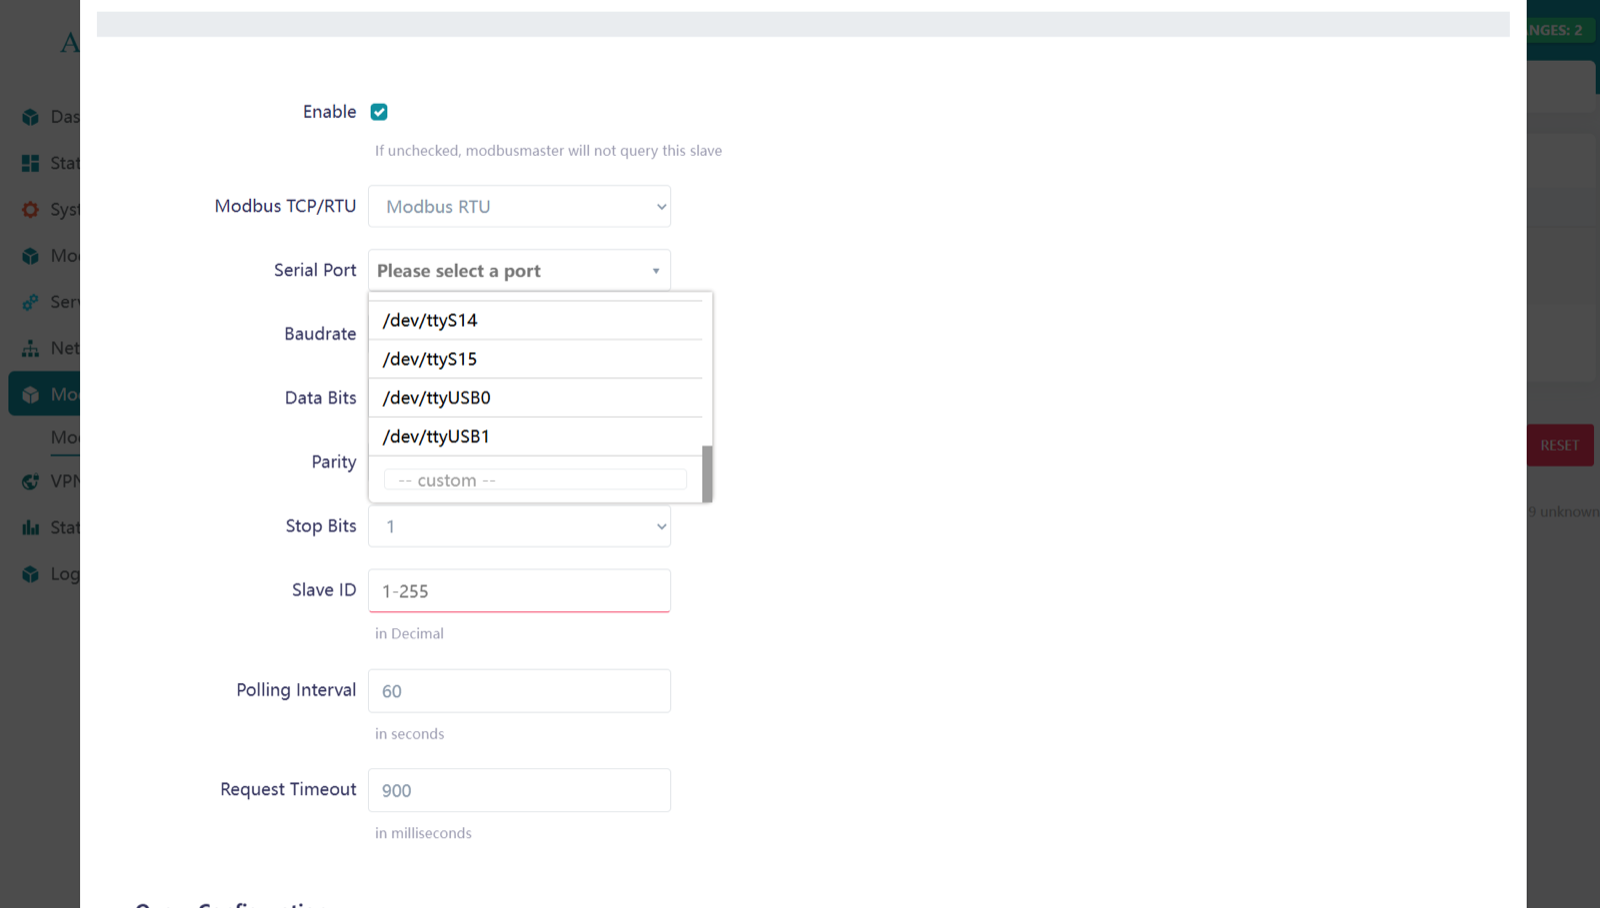
Need to enter the serial port configuration according to the slave device. Here in AG-702 serial port USB0 is for RS232 & USB1 is for RS485. If you use a USB to serial converter, you can customize the port name by adding another port.
/dev/ttyUSB0 = RS232
/dev/ttyUSB1 = RS485
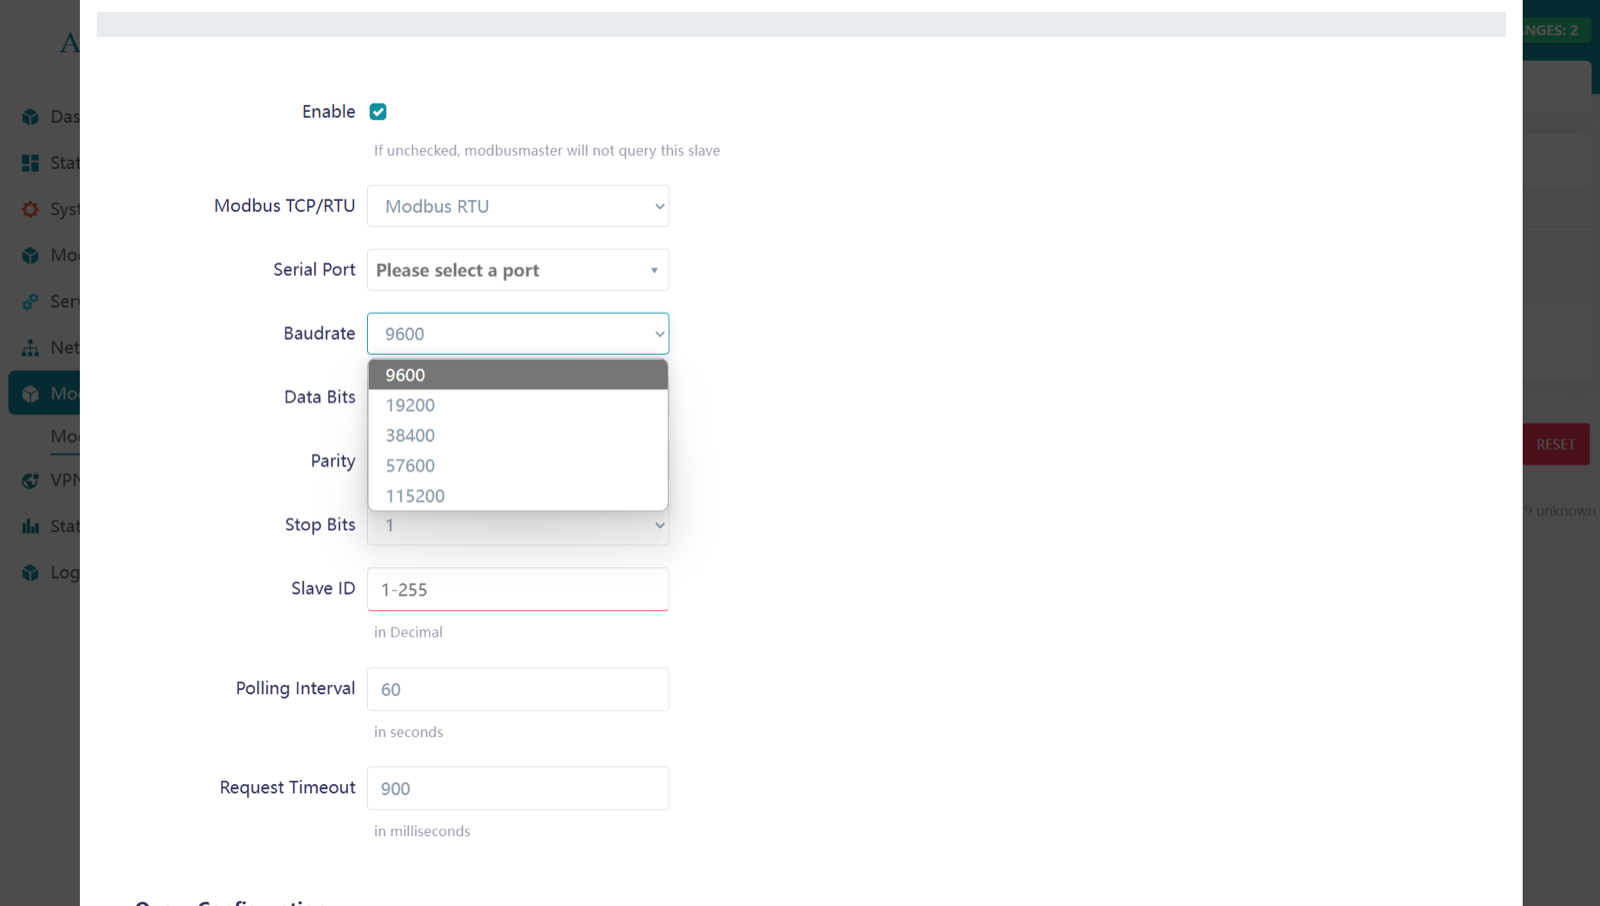
Change the baud-rate according to your slave device requirement. In Modbus RTU 9600 baud-rate is most common used.
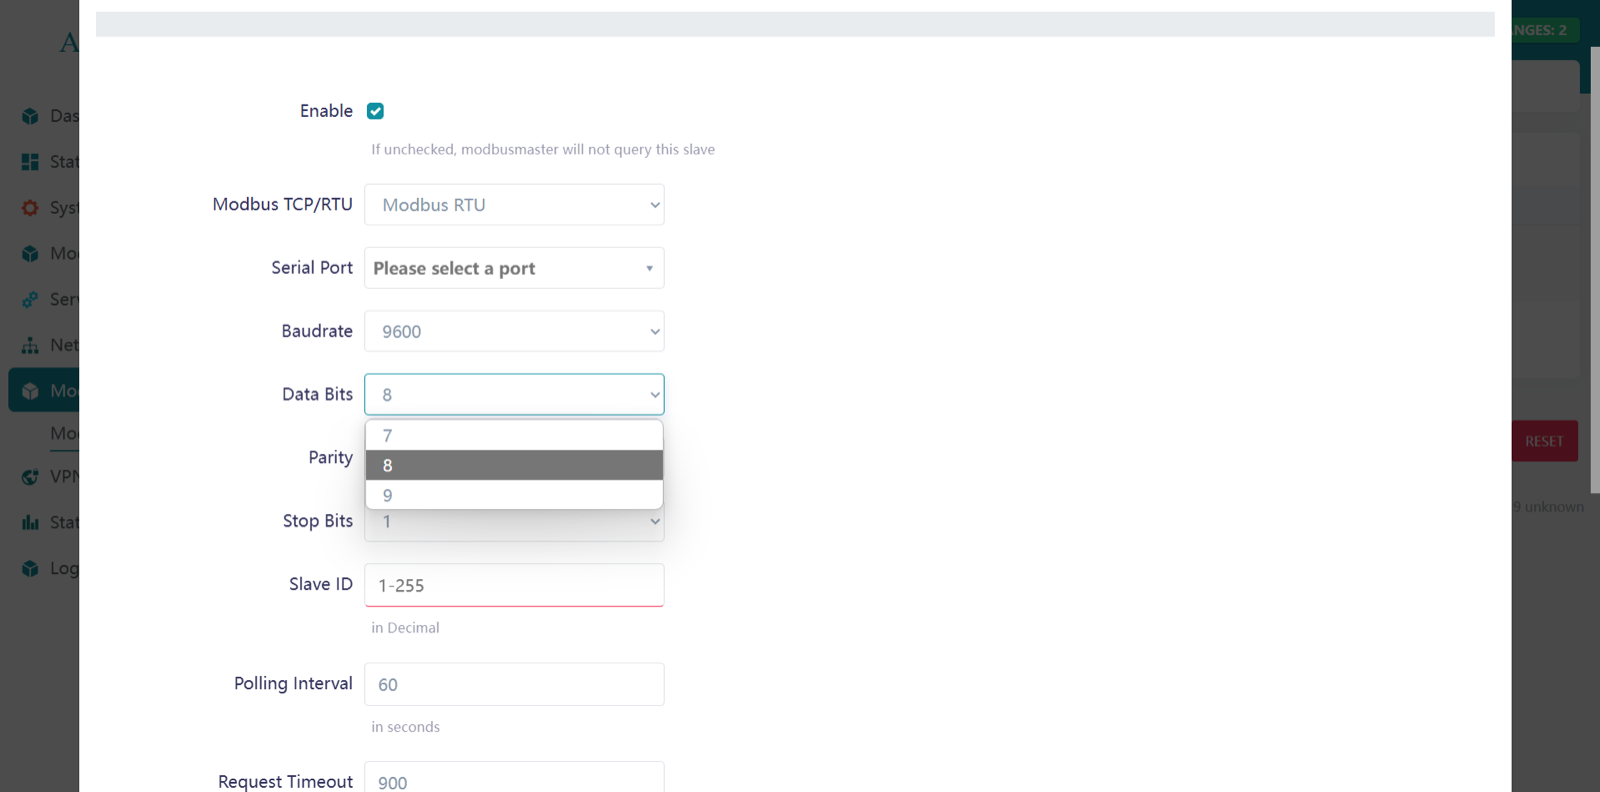
Data bits are used to represent each character or data unit in a communication protocol. Select the appropriate setting.
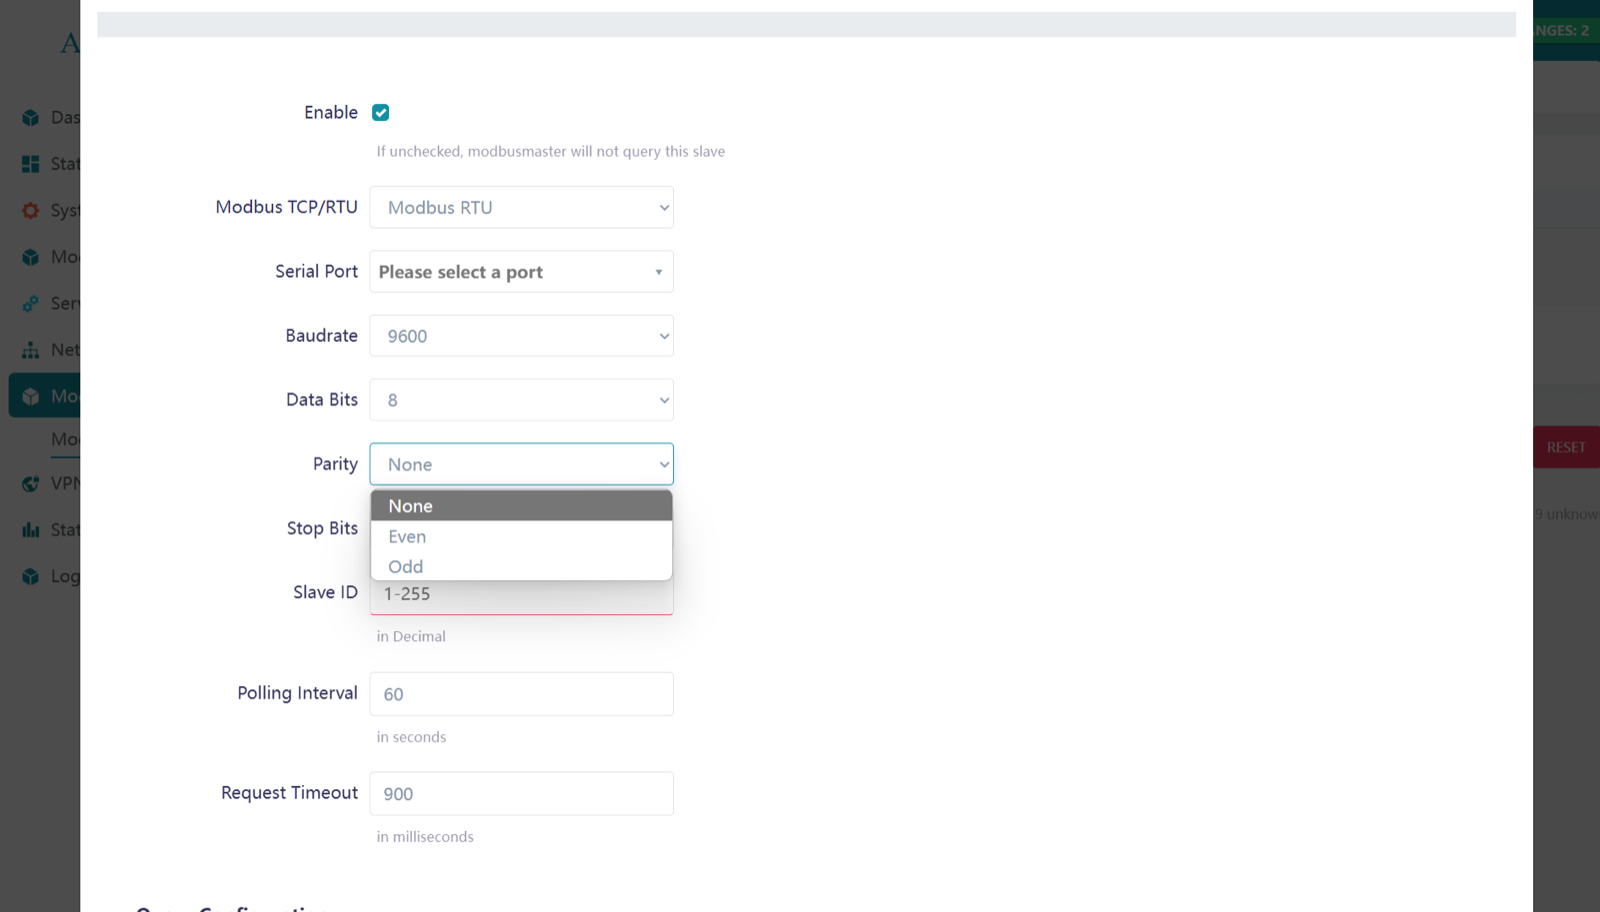
Parity is an error-checking mechanism to detect data transmission errors. Most devices use the None option.
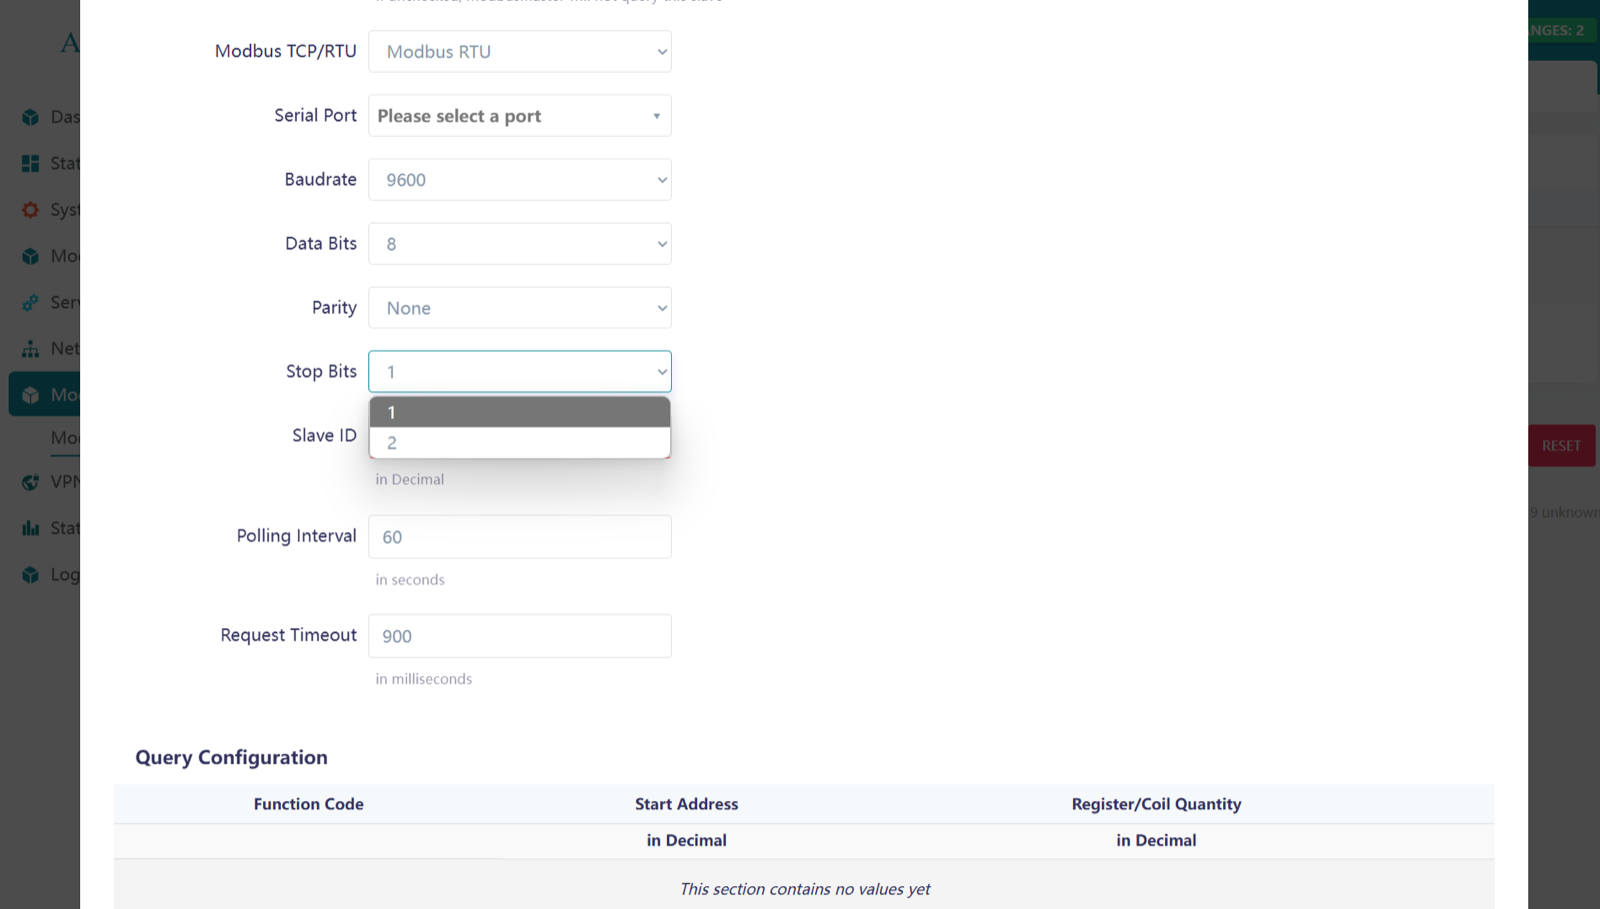
A stop bit signals the end of a data frame, helping the receiver recognize when one byte is complete.
- 1 Stop Bit: For stable connections and higher speed.
- 2 Stop Bits: For increased reliability or when devices need more processing time.
Select the option according to the slave device.
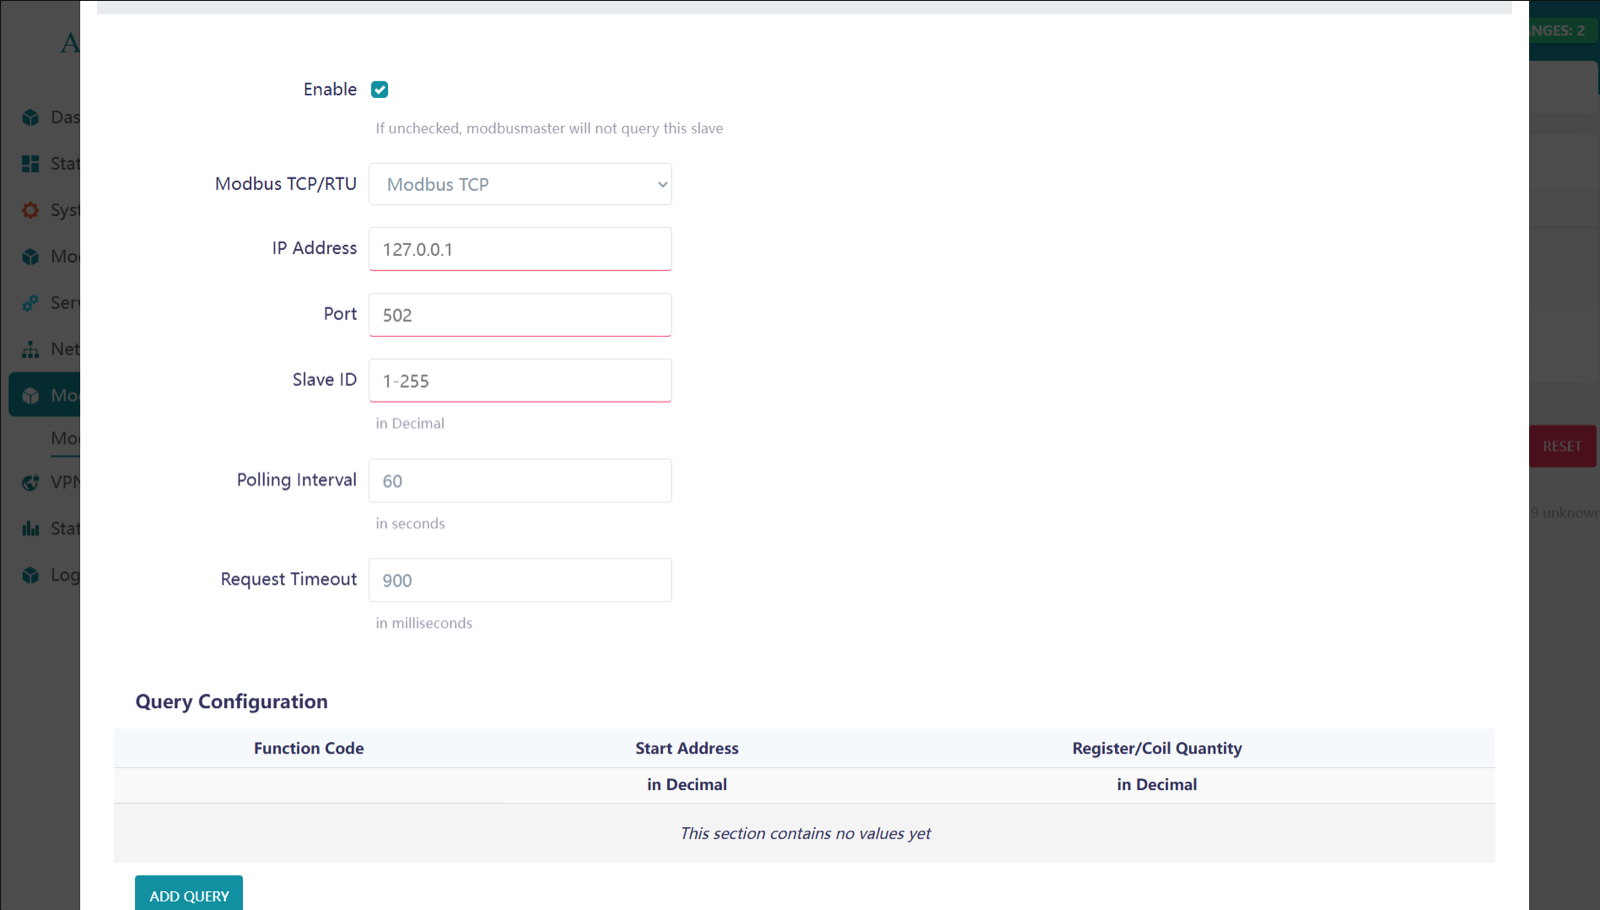
Modbus TCP/IP
In Modbus TCP/IP, only the IP address and port number (typically 502) are required for communication.
Modbus slave
After entering these parameters, the next configuration steps are the same for both Modbus TCP and Modbus RTU.
You should enter the slave ID (1-255), polling interval, and request timeout according to your requirements.
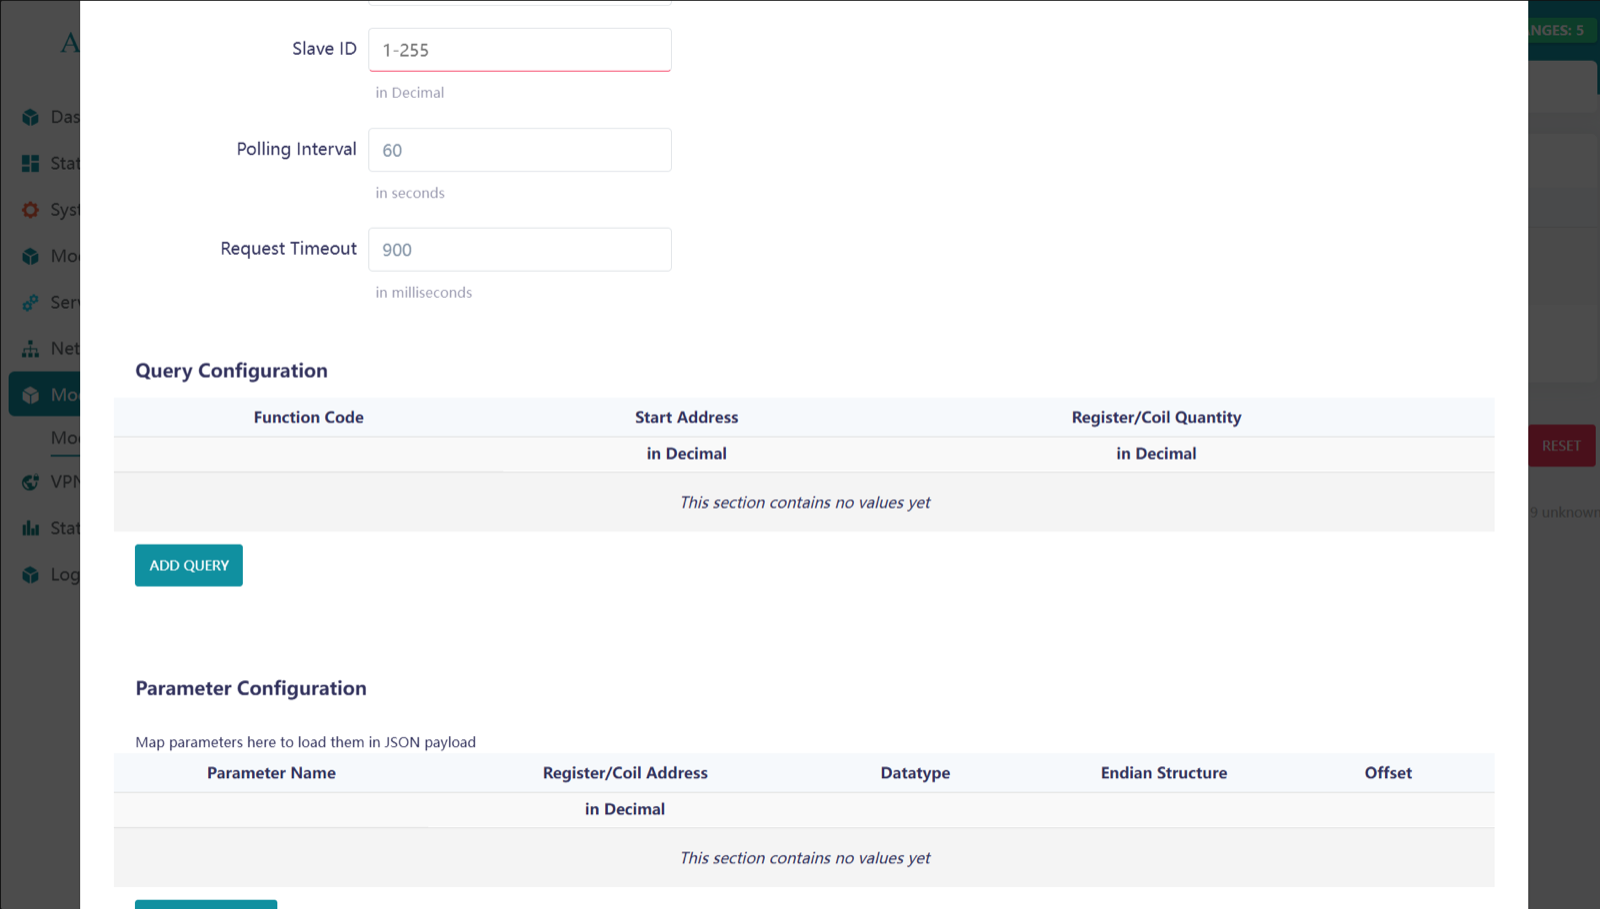
Query Configuration
To make a Query, click on ADD QUERY
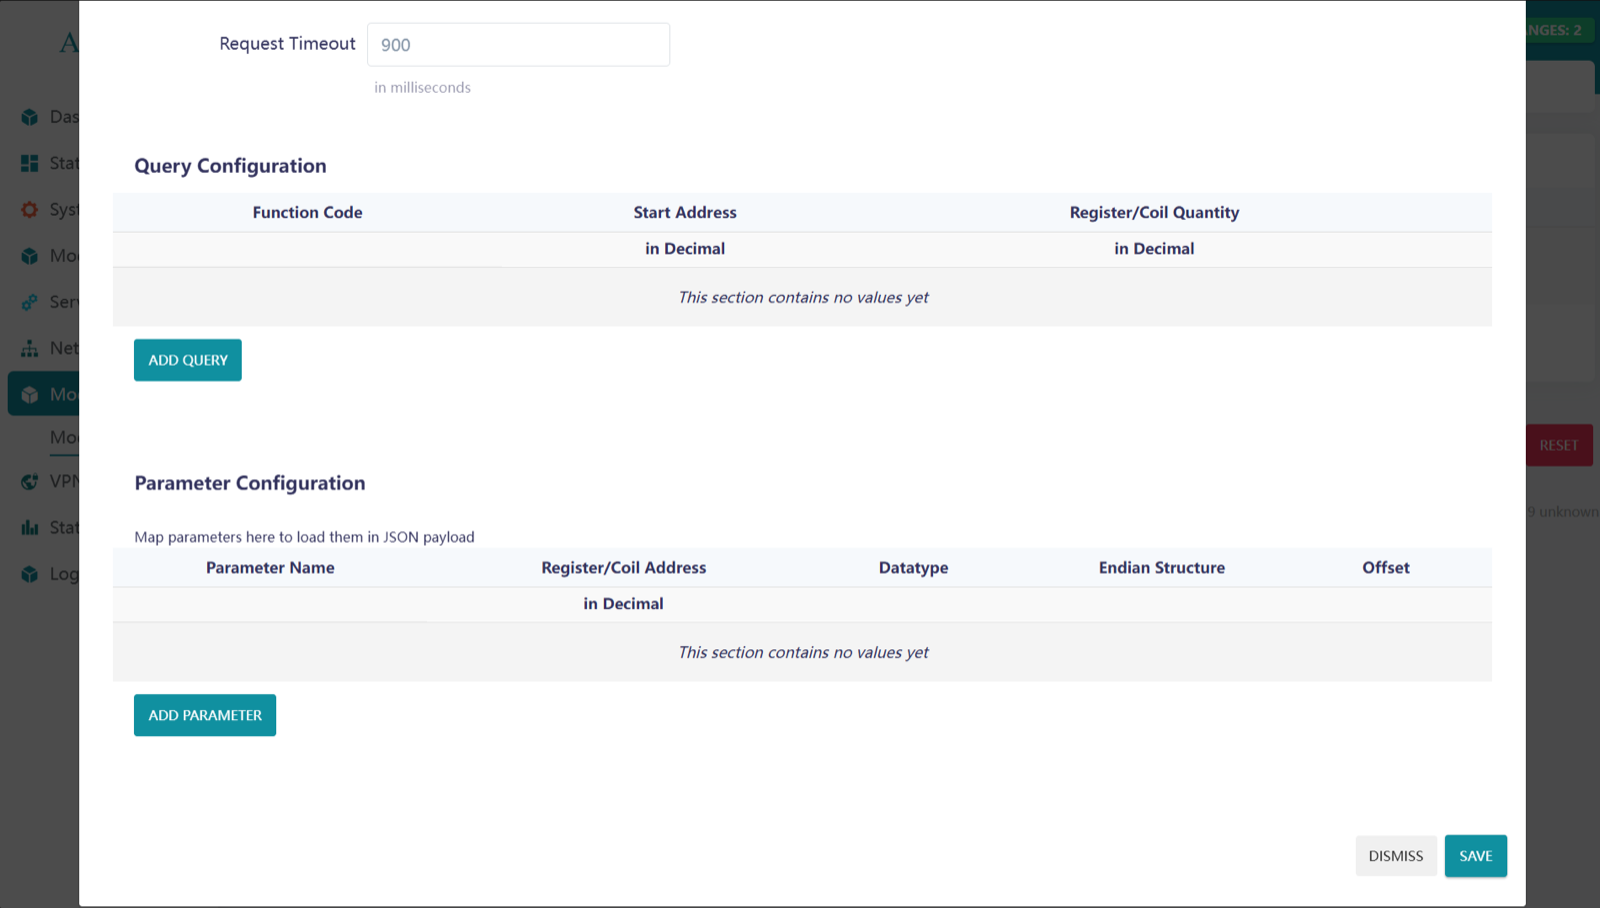
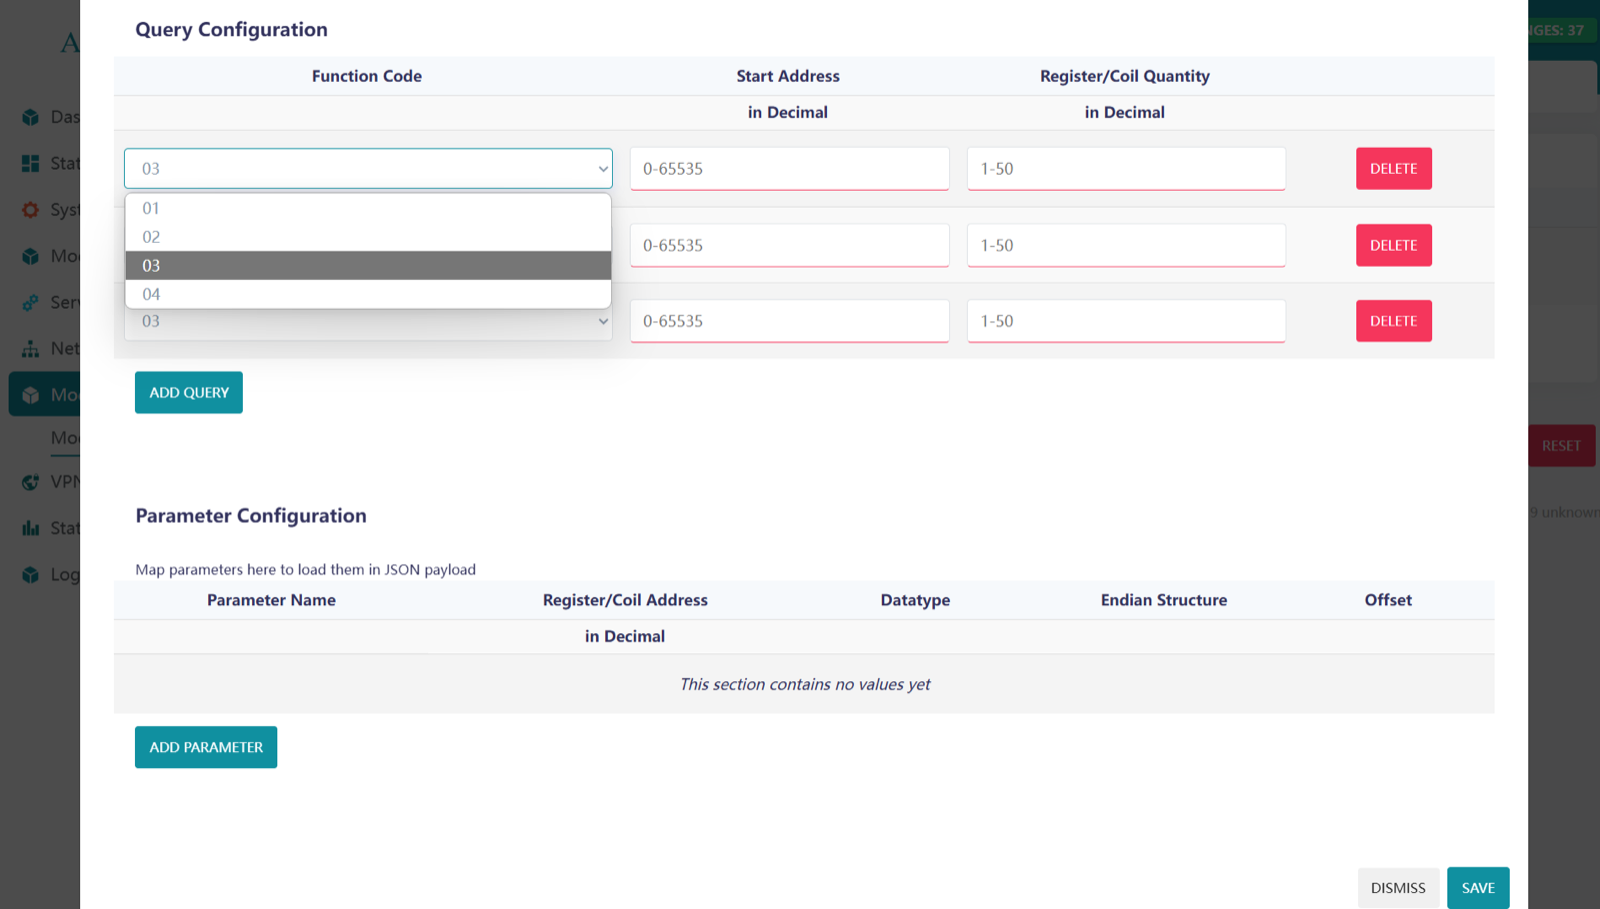
Enter the Function code, Start Address, Register/Coil number as per the Slave documentation or instruction. Here 1-50 register/coil quantity is supported.
Parameter Configuration
Enter and select the option as per your requirement.
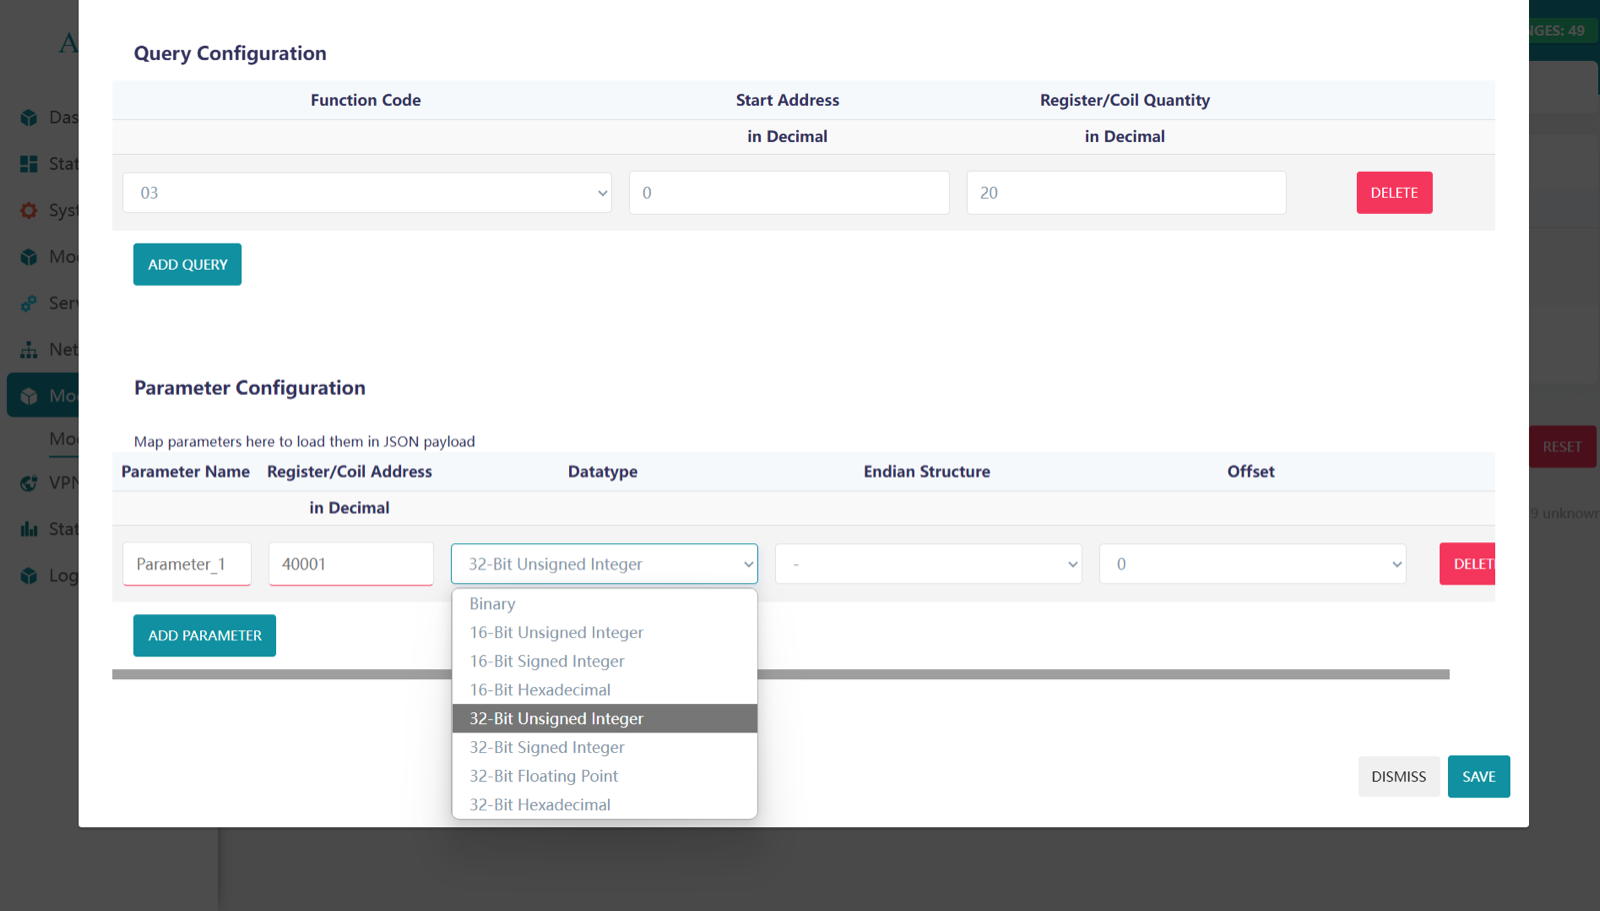
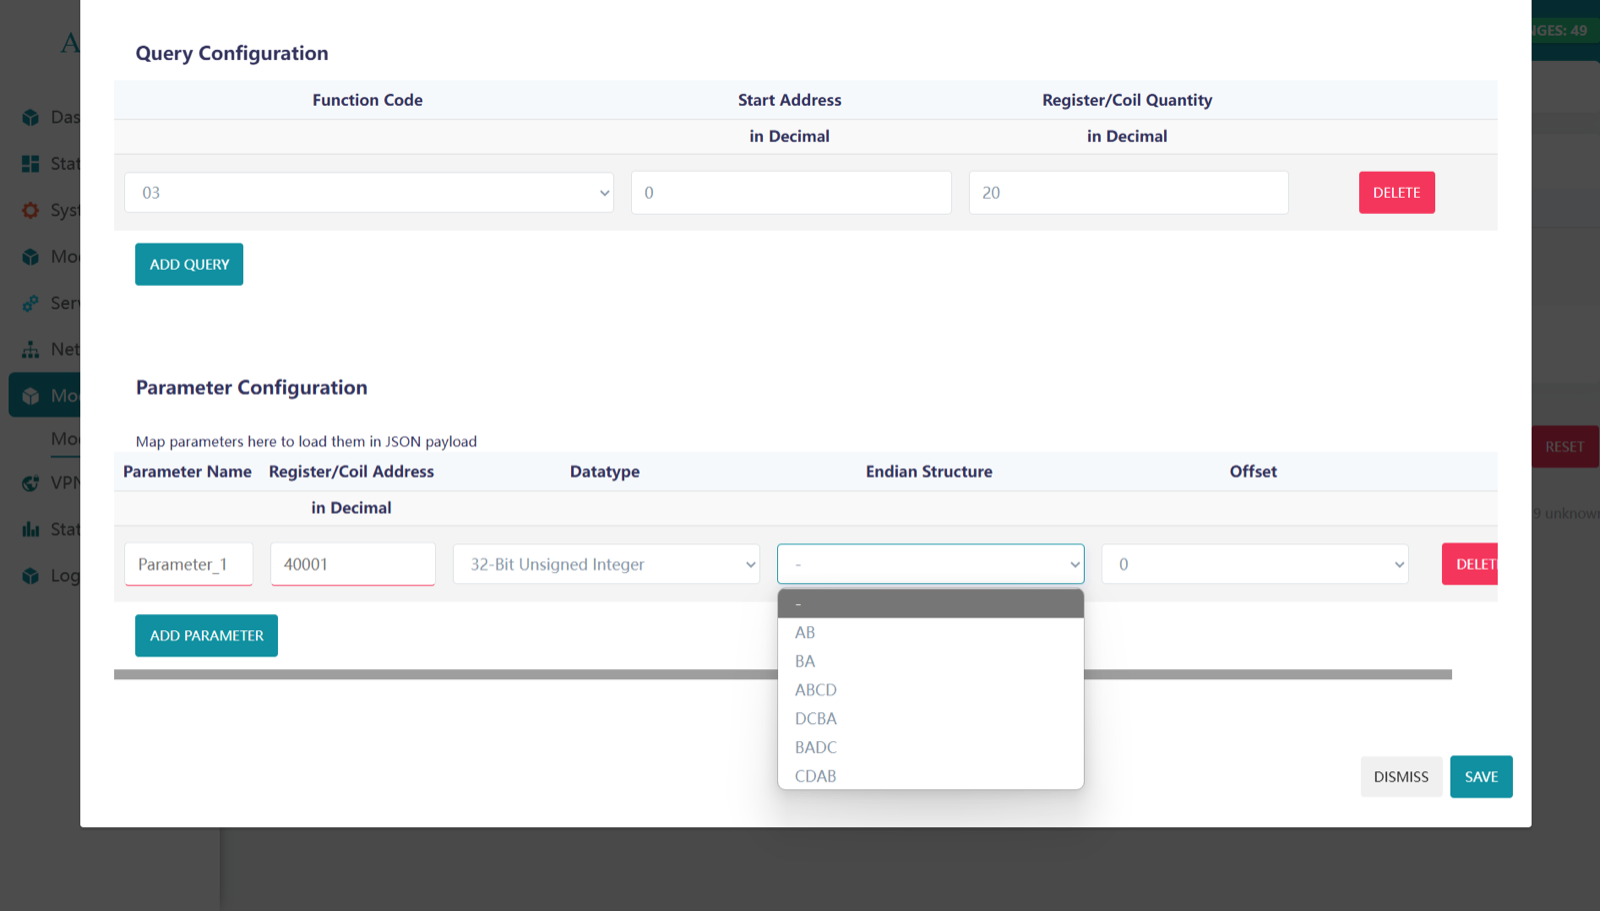
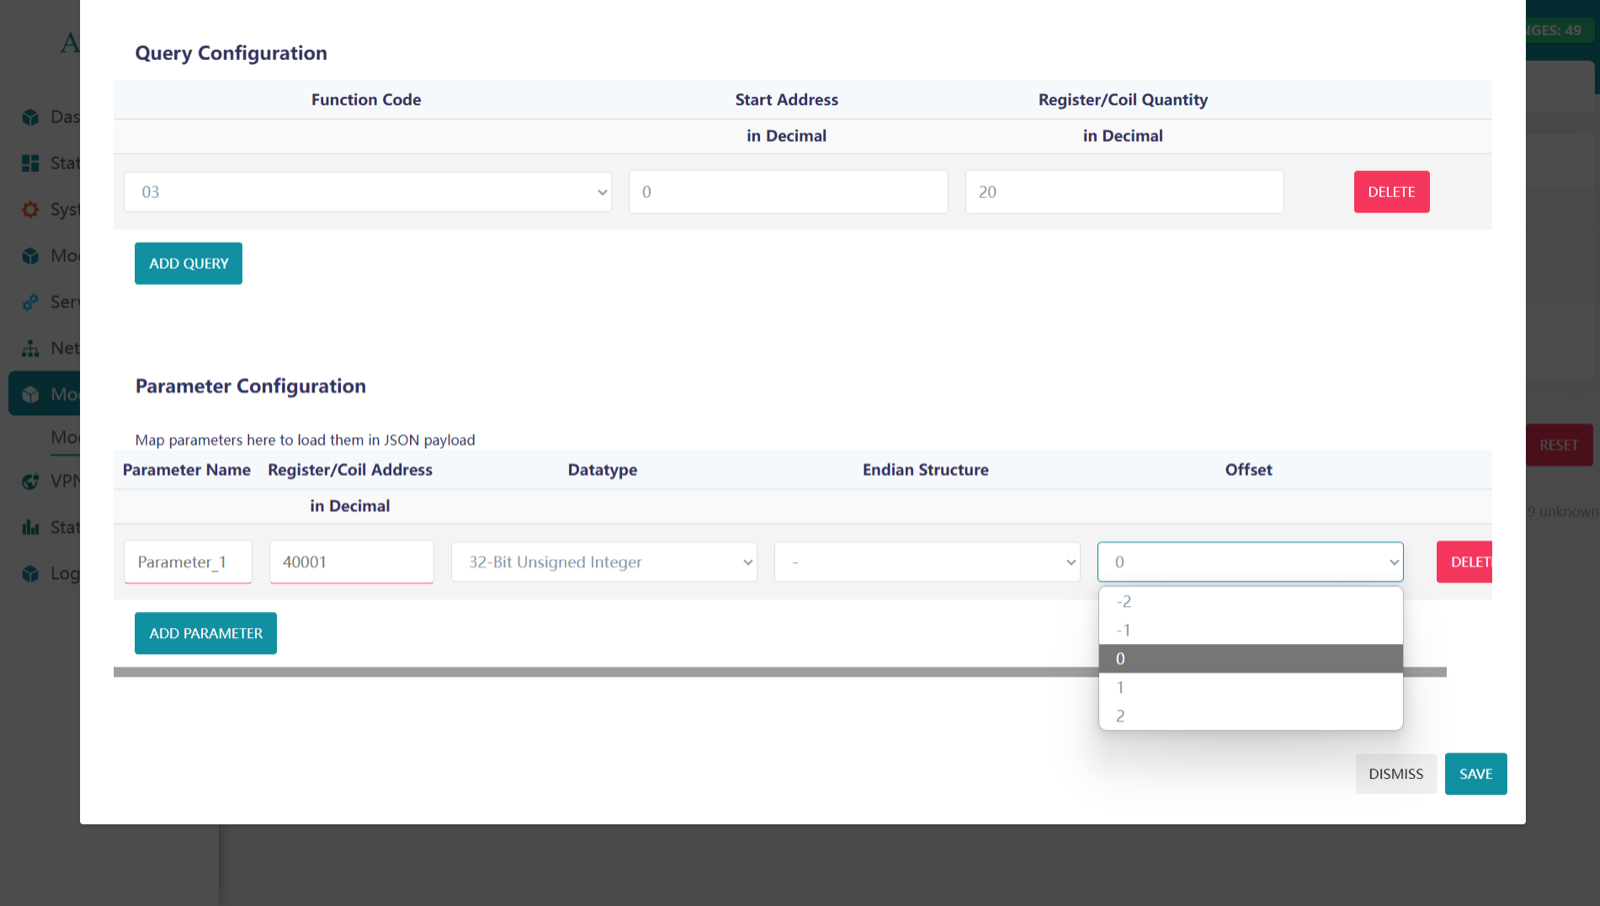
Click on SAVE after entering and selecting the Parameters.
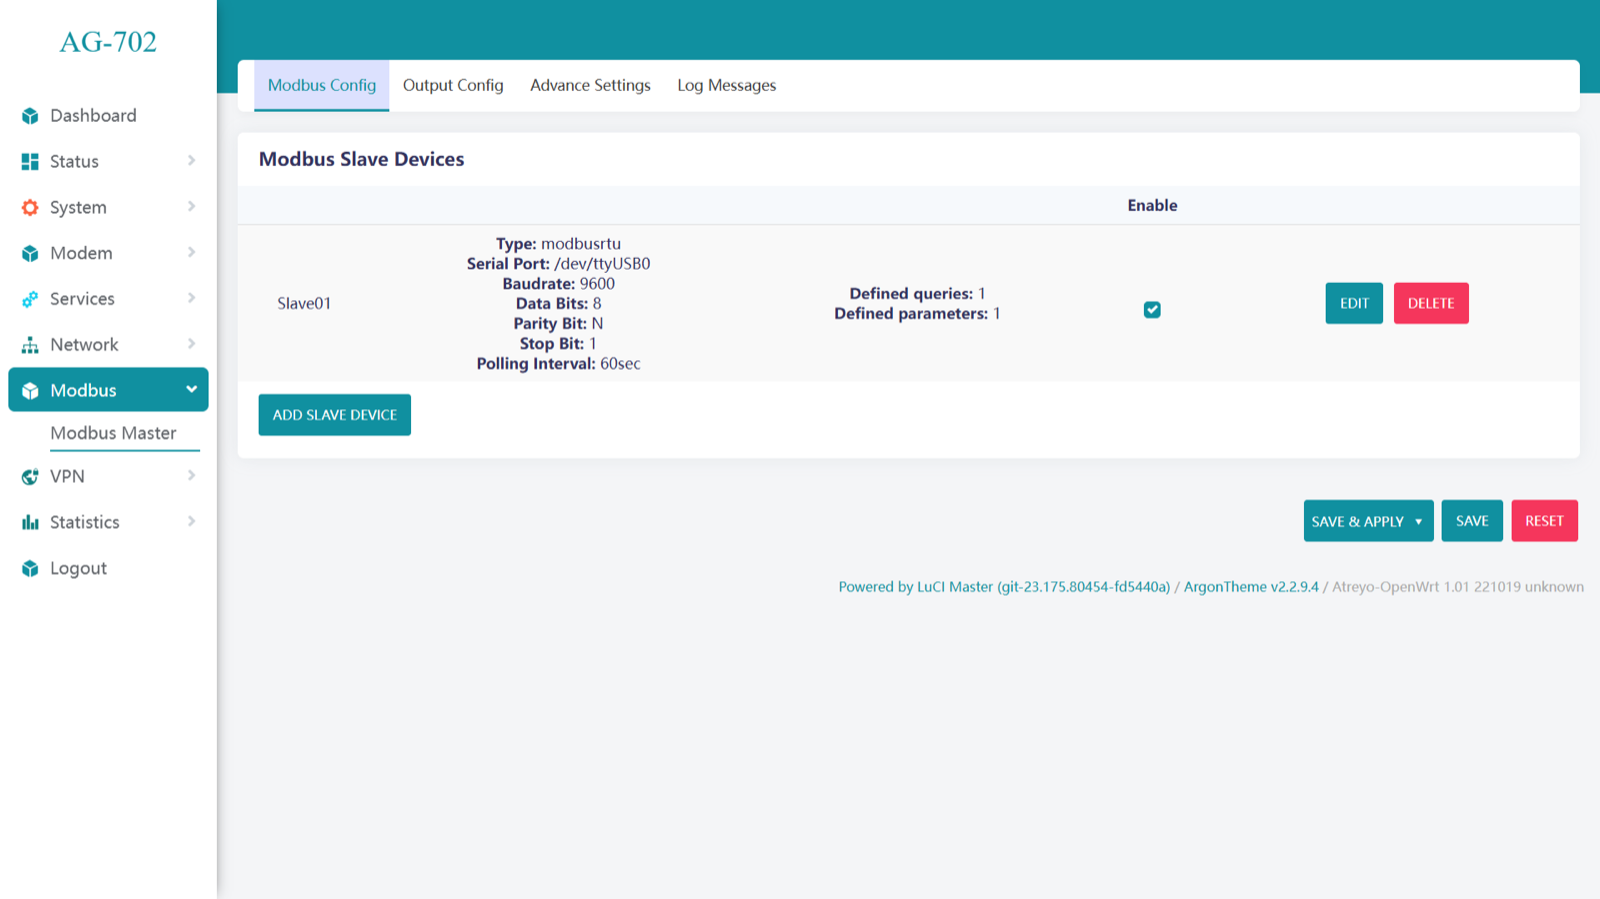
This is how we can configure Modbus and view the details.
And for another slave do the same process by click on ADD SLAVE DEVICE.
Data output configuration
Click on Output configuration. There are two option:
- Save Data to File.
- Send Data to Server.
We can choose both options and then the data is both sent to the server and saved locally.
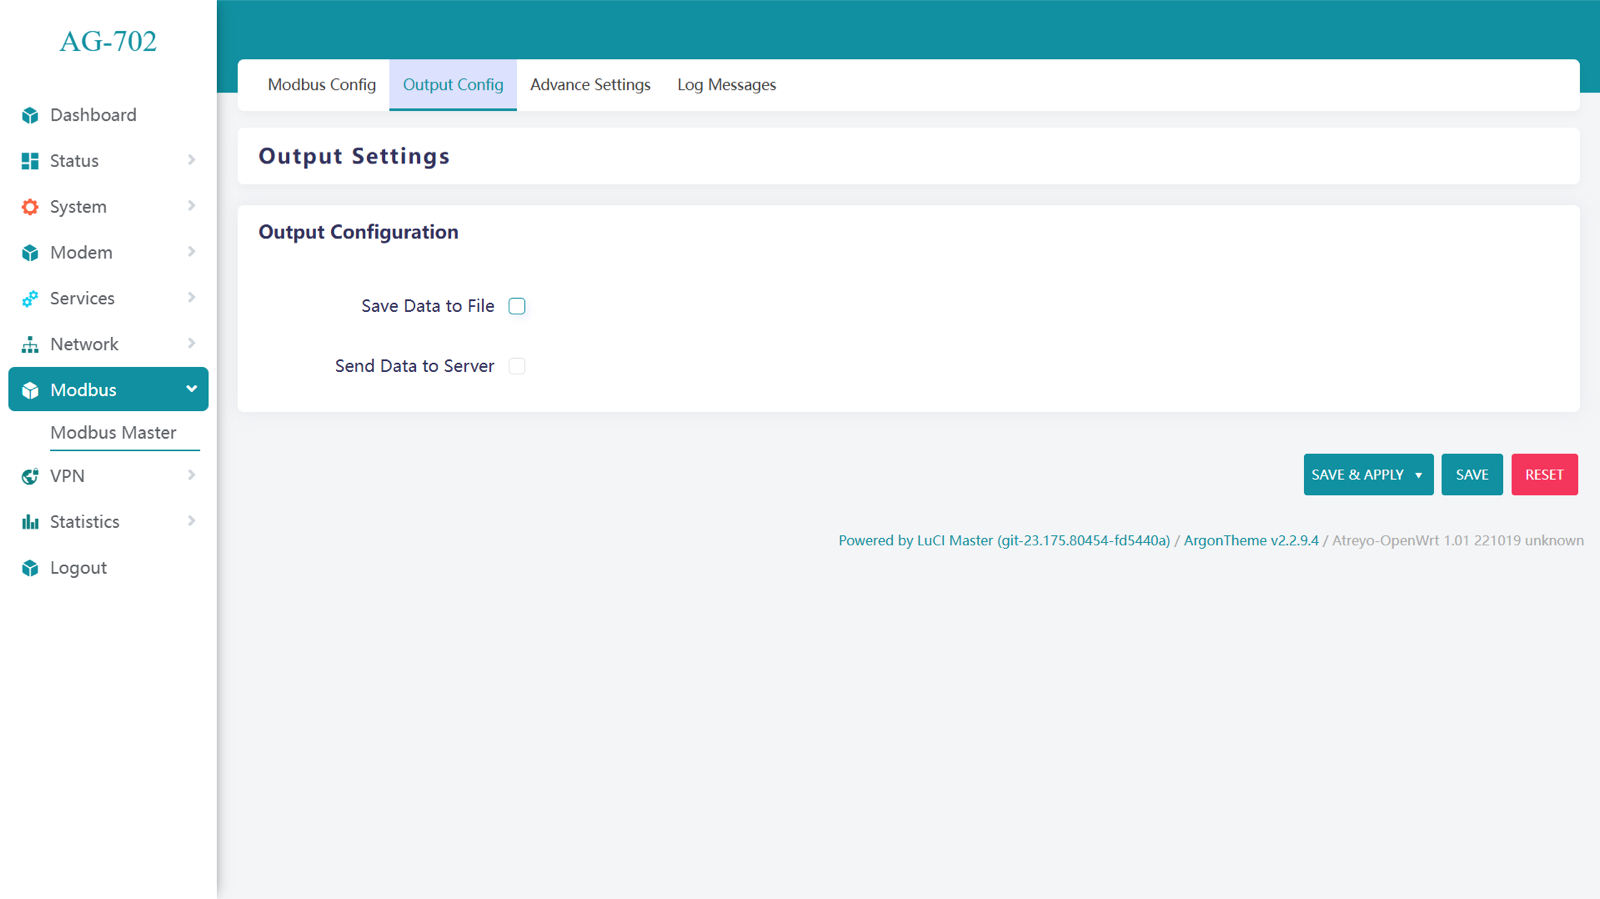
If Save Data to File is selected, it is necessary to specify the folder path.
Send data to server
In Send Data to Server. There are 2 option:
- ATRA-DATA
- 3rd-PARTY-PLATFORM
Atra-Data is Atreyo's system for quick and easy presentation of data in the cloud. In the case of 3rd-PARTY-PLATFORM, we can choose any data platform that communicates using one of the selected ports: HTTP, MQTT or TCP/IP.
ATRA-DATA
ATRA-DATA. In This Data is send direct to the ATRA server without any aditional configuration.
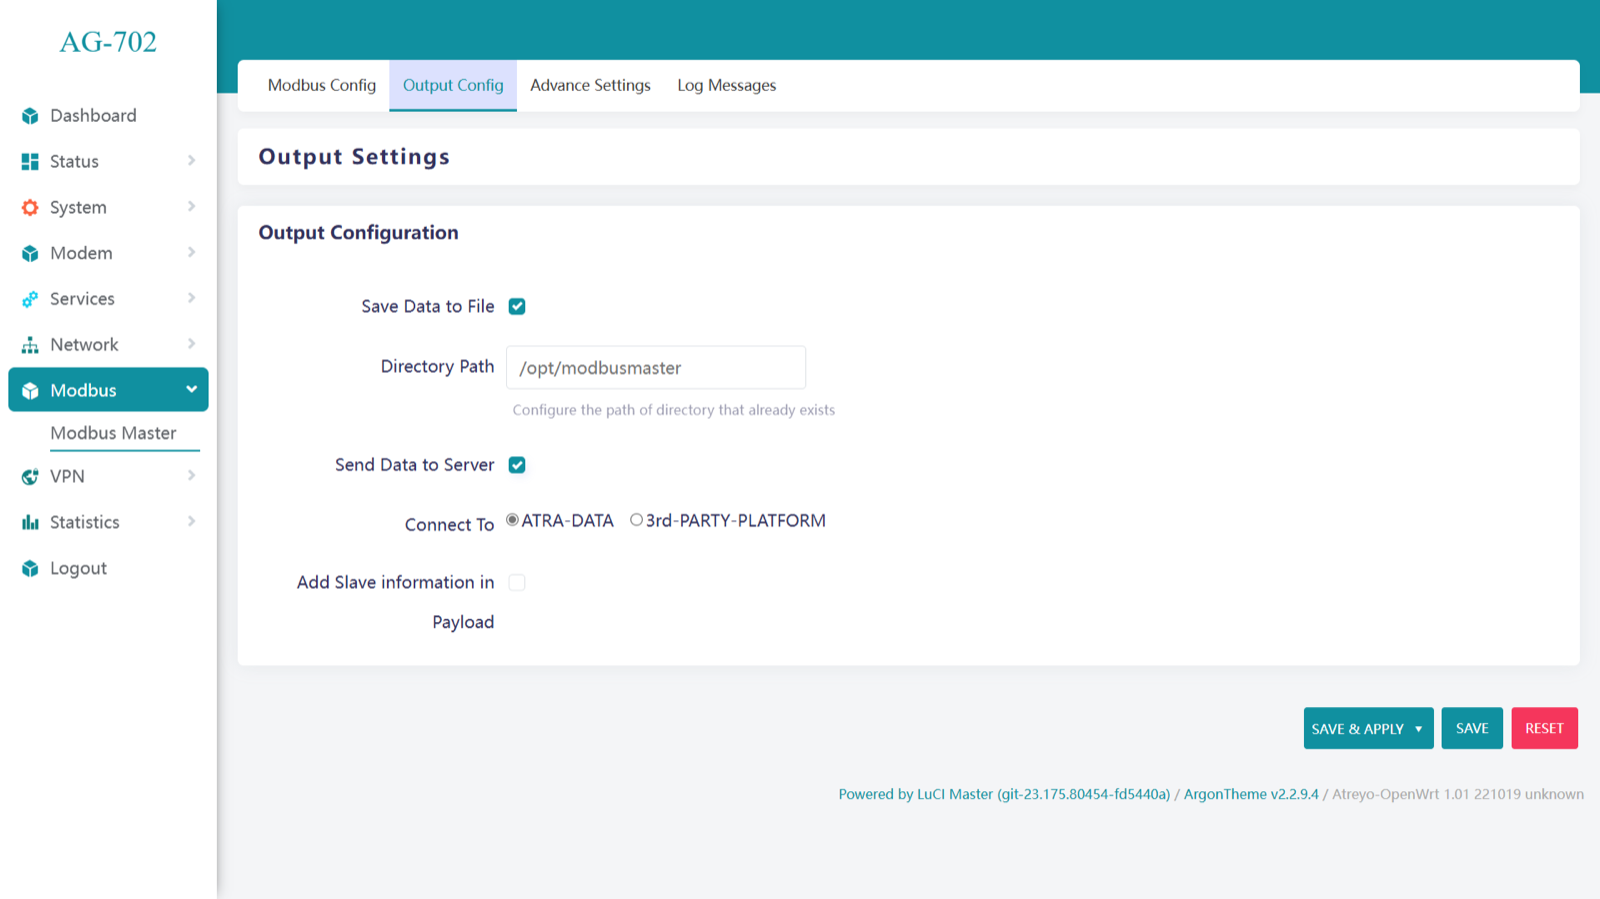
3rd-PARTY-PLATFORM.
There are some parameter required to select protocol – HTTP, MQTT, TCP/IP.
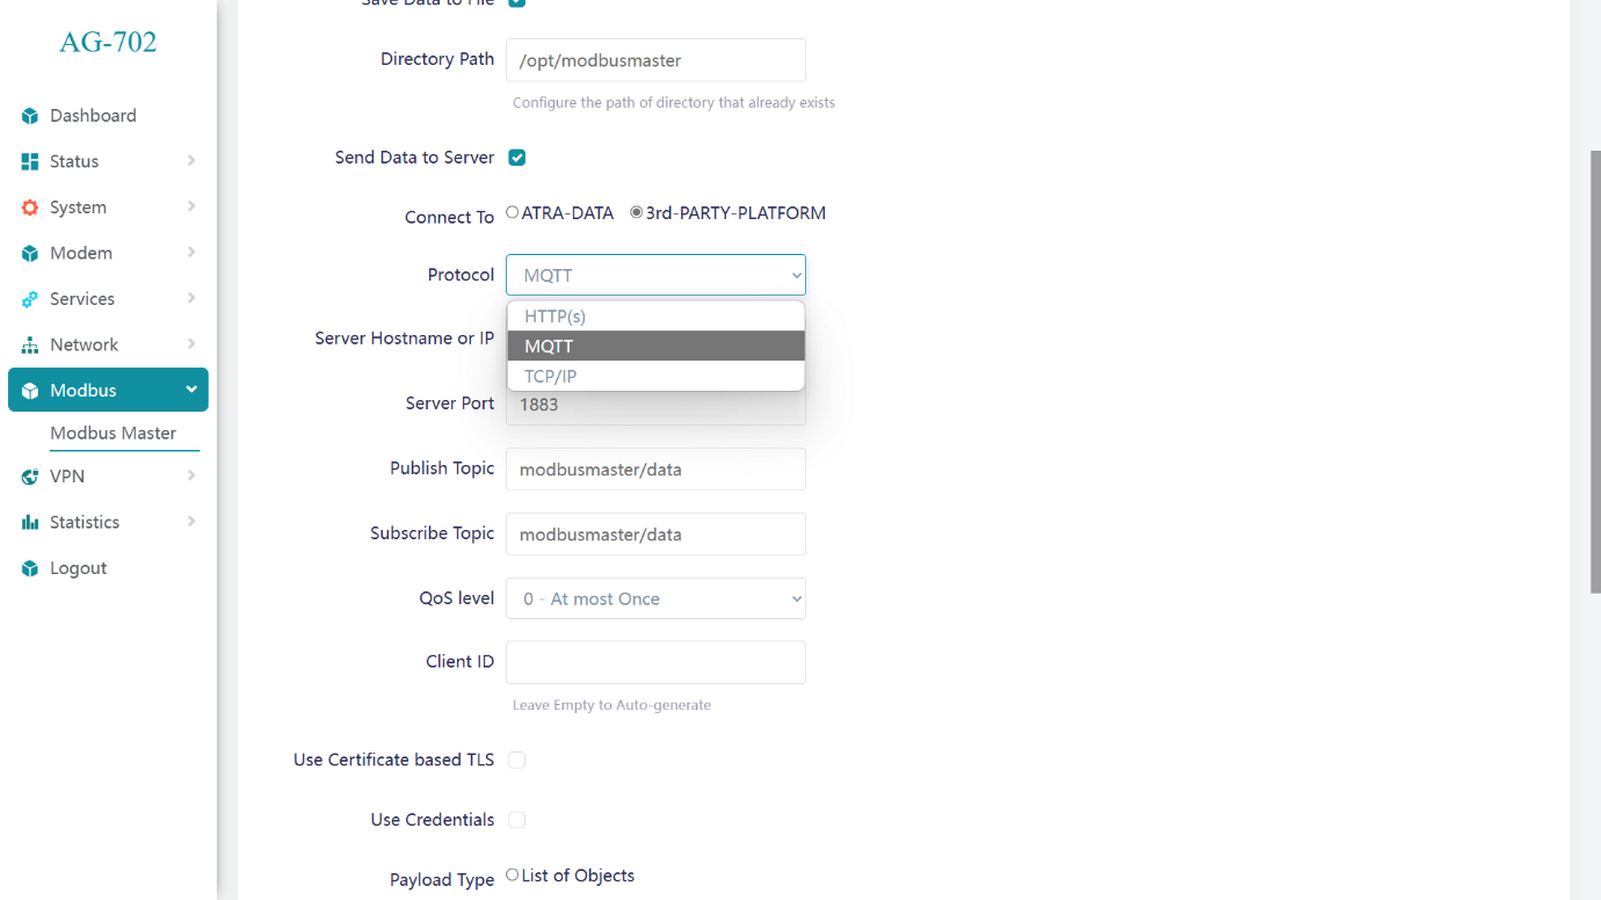
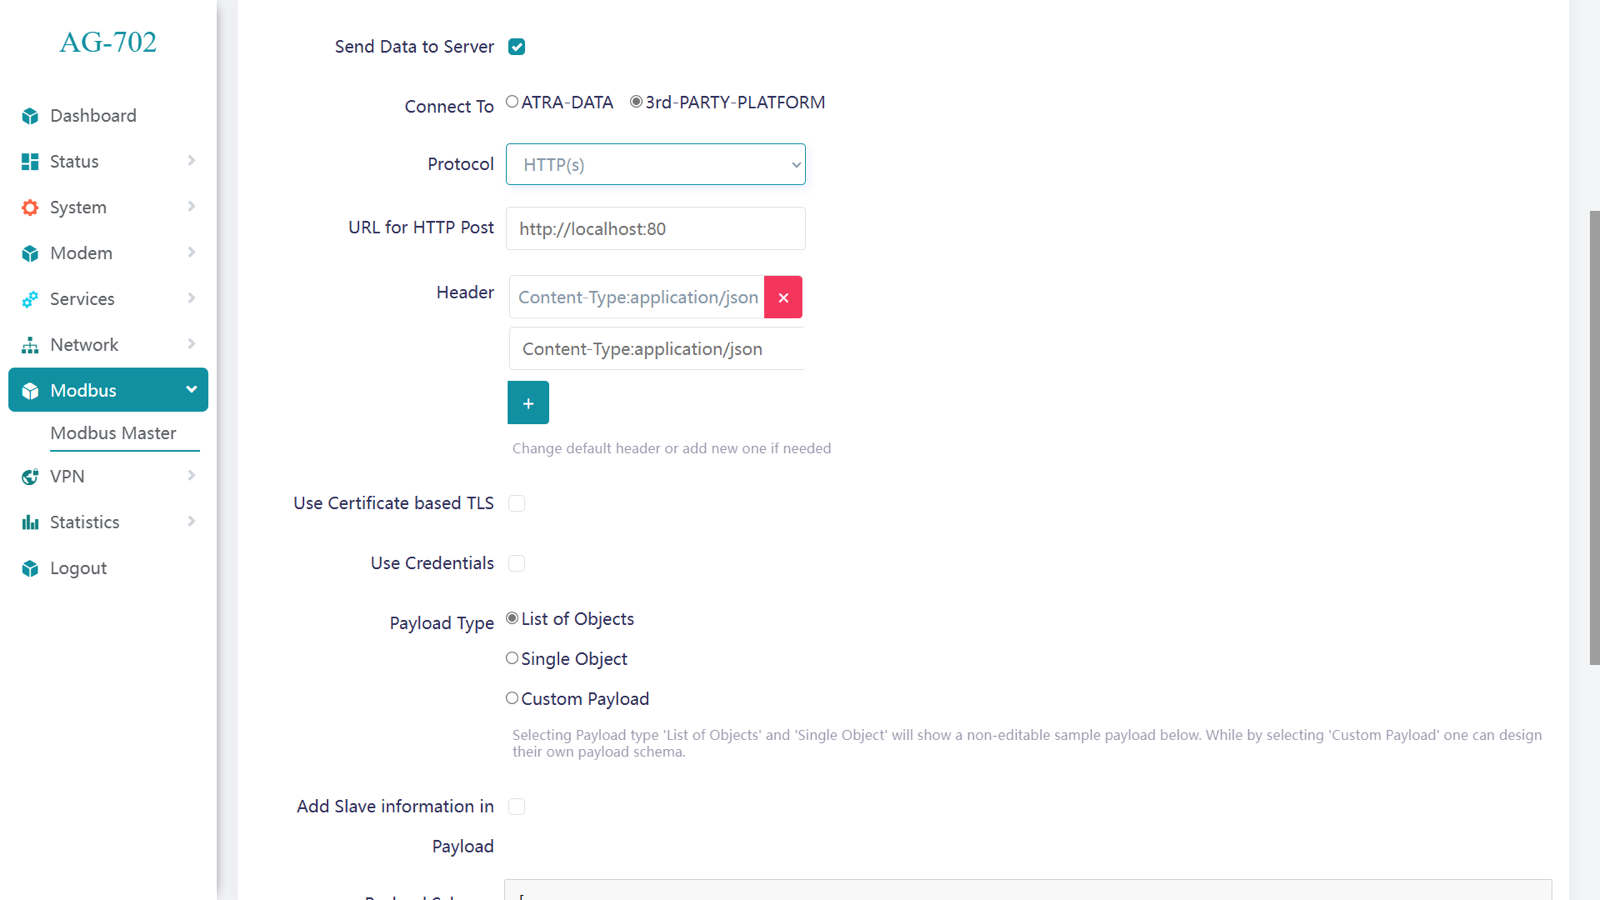
HTTP(s)
Enter the URL For HTTP Post and Header. Where able to Change default header or add new one if needed.
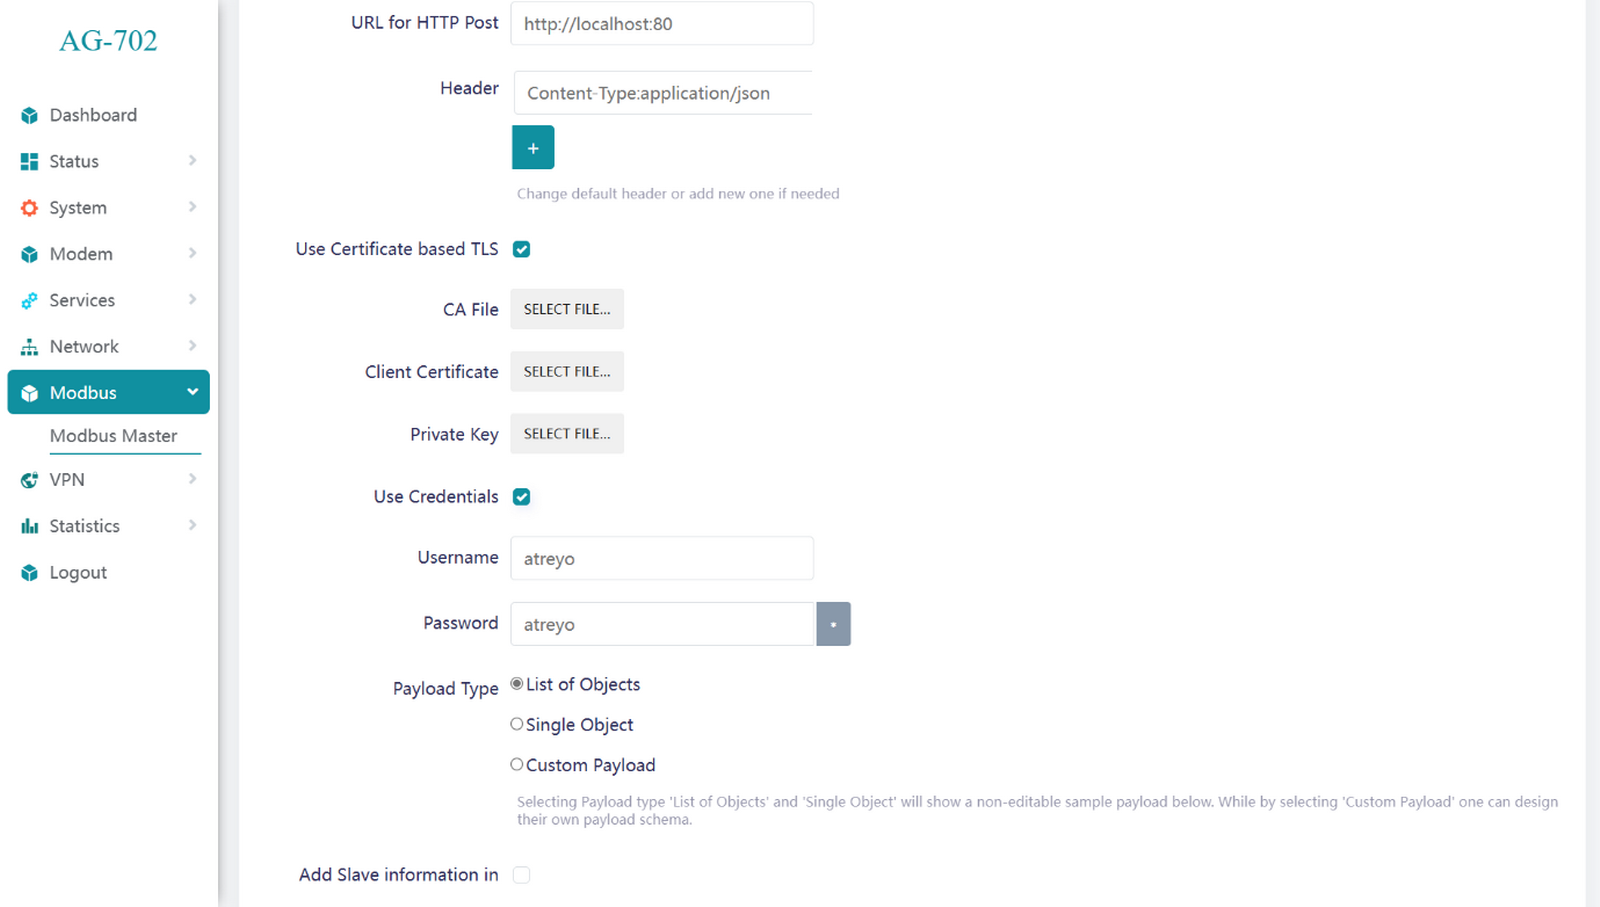
Certificates
To enhance security for data transmission, you can use certificate-based TLS along with credentials.
Certificate-based TLS (Transport Layer Security) require CA(Certificate Authorities) file, Client Certificate and Private key
Credentials often require a username and password for authentication and access control in secure systems.
MQTT
Enter the Server Hostname/IP, Server Port, Publish Topic and Subscribe Topic. Select QoS level as per requirement and Client ID it is Auto-generate.
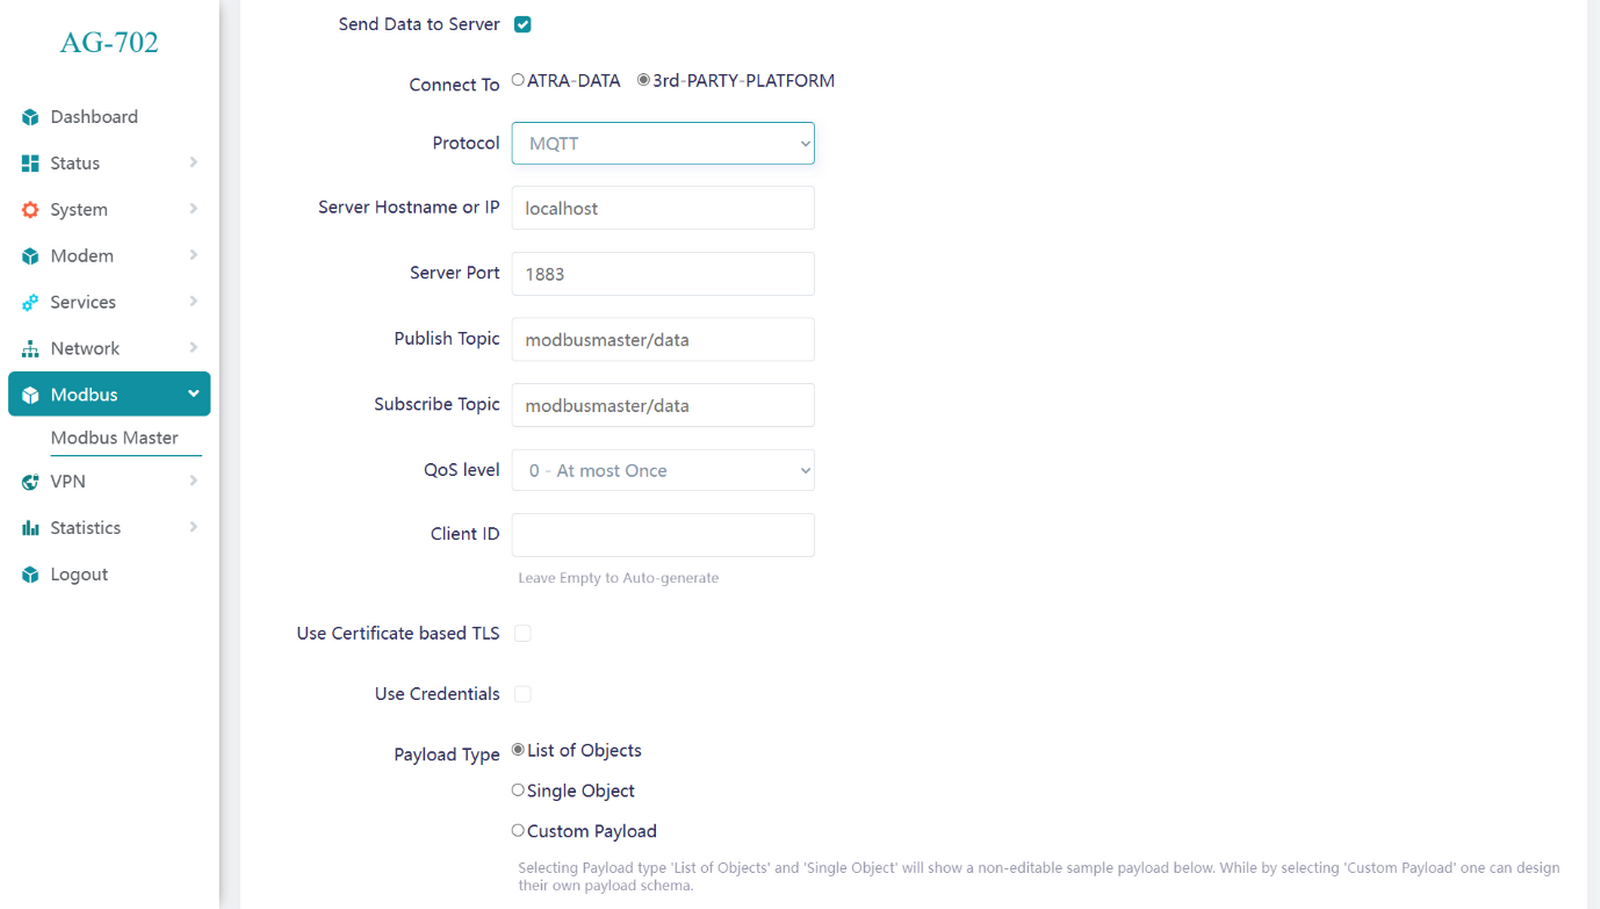
QoS (Quality of Service) level
- QoS 0 (At most once): Fast, no acknowledgment, possible message loss.
- QoS 1 (At least once): Acknowledged, possible duplicates.
- QoS 2 (Exactly once): Highest reliability, no duplicates, uses a four-step handshake.
Modbus master 5.6.2
| Modbus Master | Version | 5.6.2 |
1.1 Open Modbus Master
From the OpenWrt/LuCI interface, open the Modbus Master application. The main page contains the Modbus Slave Devices area and the Add Slave Device action.
1.2 Main Configuration
Use this page as the starting point for creating and managing slave devices.
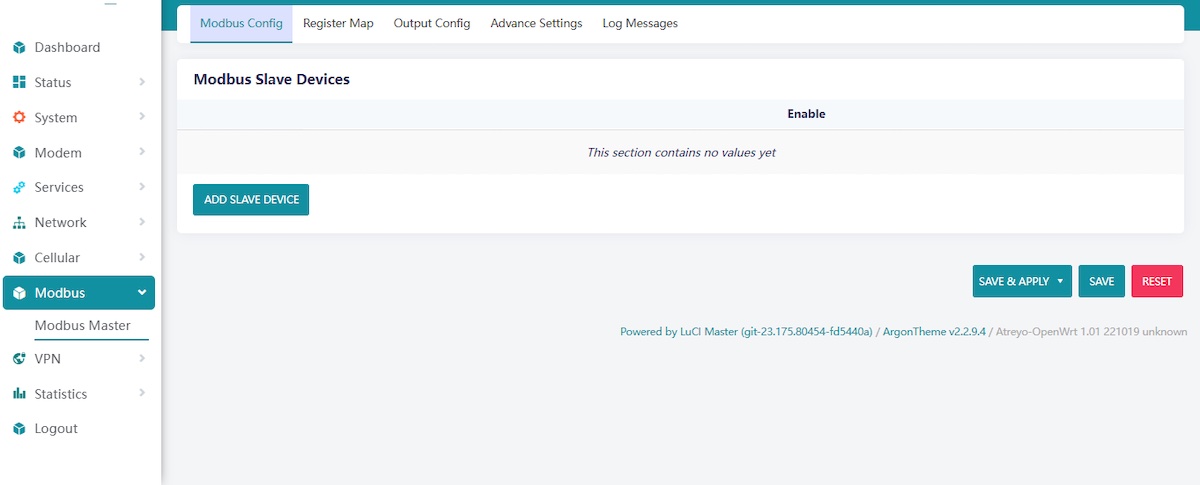
Main Modbus Config screen — This is the starting page. Click Add Slave Device to create a new Modbus connection.
1.3 Add a Slave Device
Click Add Slave Device, enter a unique device name, and choose Modbus TCP or Modbus RTU.
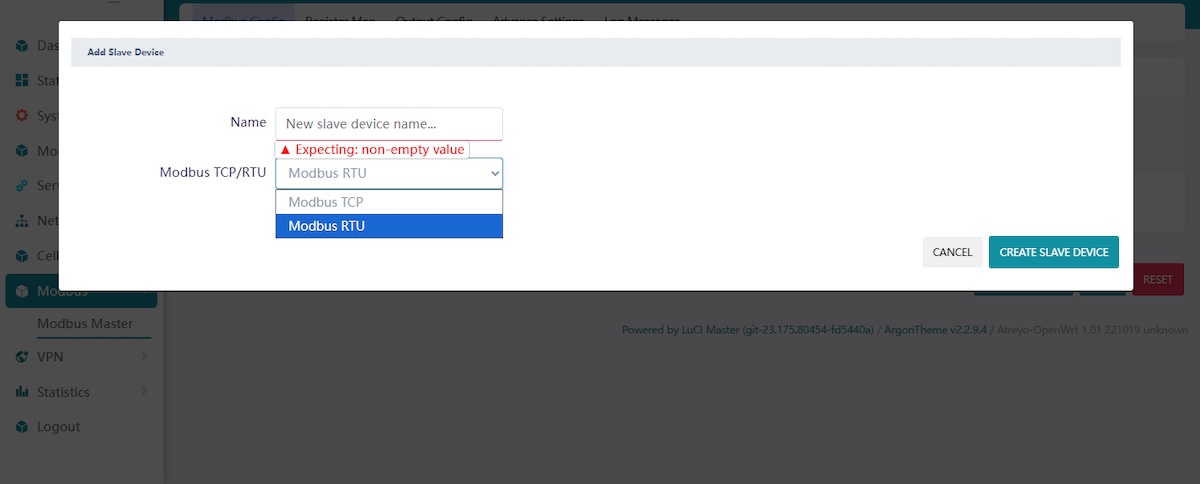
Add Slave Device — Enter a unique device name and select Modbus TCP or Modbus RTU.
1.4 Configure Slave Communication Communication
After creating the slave, configure the communication fields. For TCP, enter the IP address and port. For RTU, select the serial port and match baudrate, data bits, parity and stop bits. Then set the Slave ID, polling interval, optional archive polling interval and request timeout.
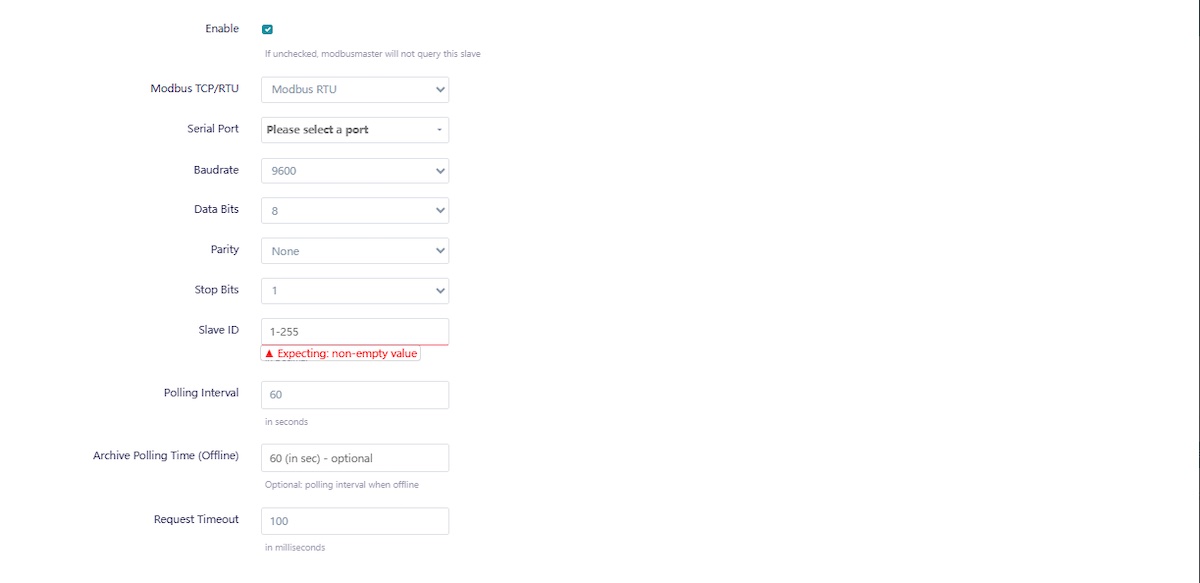
Slave Device Settings — Enter the communication values, Slave ID, polling interval, optional archive polling interval and request timeout.
1.5 Create a Modbus Query
A query defines which Modbus data the application reads. Add a query, choose one of the function codes available in this UI, then enter the start address and quantity.
| Field | What to enter |
|---|---|
| Function Code | Choose the function matching the slave's Modbus map. |
| Start Address | Enter the address in decimal as required by the device/application addressing convention. |
| Register/Coil Quantity | Enter how many consecutive data items should be read. |

Query Configuration — empty — Click Add Query to create a query definition.

Query Configuration — adding a query — Select the function code, then enter the start address and quantity.
1.6 Map Returned Parameters
Parameter mapping gives a meaningful name to returned Modbus data and tells the application how to interpret it for the JSON payload.
| Field | Purpose |
|---|---|
| Parameter Name | Name used in the JSON payload. |
| Register/Coil Address | Modbus address from which the parameter is read. |
| Datatype | Interpretation of the returned value, for example 16-bit, 32-bit, 64-bit or floating point. |
| Endian Structure | Byte/word ordering for multi-byte values, according to the device map. |
| Offset | Address adjustment selected by the application. |
Parameter Configuration — empty — Click Add Parameter to map a value into the JSON payload.

Parameter Configuration — adding a parameter — Enter the parameter name, address, datatype, endian structure and offset.
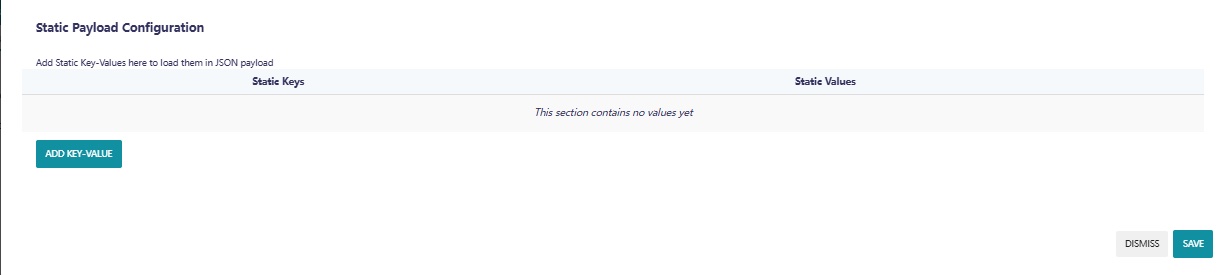
1.7 Add Static Key-Value Pairs
Static payload values are fixed fields that can be included in the JSON payload in addition to values read from Modbus.
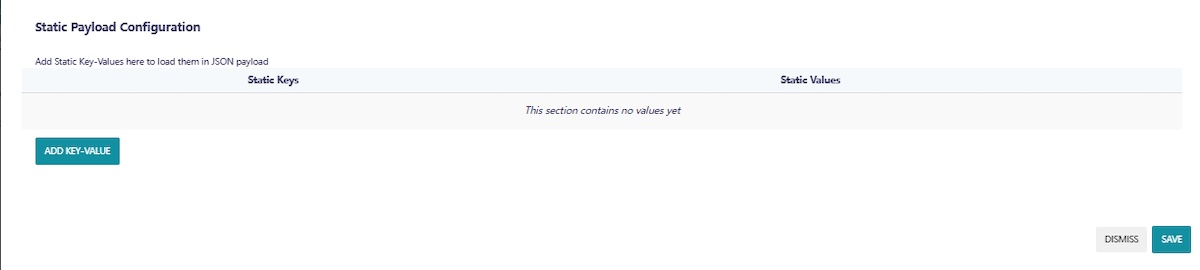
Static Payload Configuration — empty — Click Add Key-Value to add a fixed field to the JSON payload.
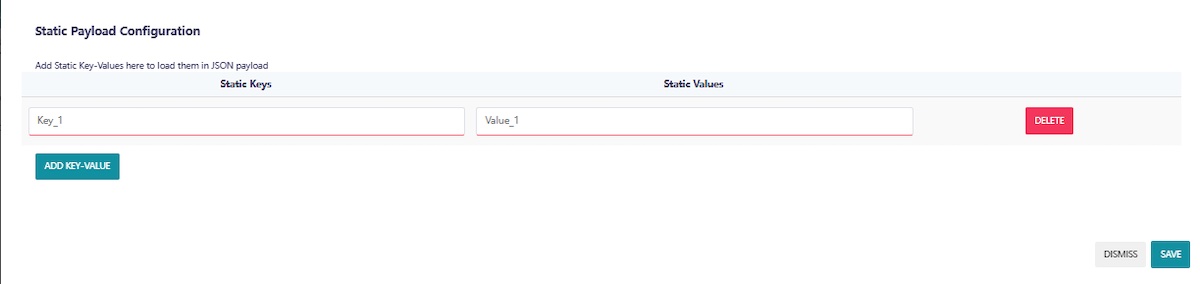
Static Payload Configuration — adding a key-value pair — Enter the static key and its fixed value.
1.8 Polling, Timeout & Save
| Setting | Current application behavior |
|---|---|
| Polling Interval | Normal polling interval in seconds. The current UI defaults to 60 seconds. |
| Archive Polling Time (Offline) | Optional polling interval used when the device is offline. |
| Request Timeout | Response wait time in milliseconds. The current UI allows 1–5000 ms and defaults to 100 ms. |
| Enable | If disabled, the Modbus Master will not query that slave. |
After configuration, save/apply the settings and verify that the slave responds with the expected data.
1.9 Recommended Configuration Flow
| Step | Stage | What happens |
|---|---|---|
| 1 | Prepare | Read the slave manual and choose TCP or RTU. |
| 2 | Wire | Connect Ethernet or serial according to the wiring and communication guidance above. |
| 3 | Configure | Add the slave and set communication parameters. |
| 4 | Query | Create queries and map parameters. |
| 5 | Validate | Check returned values, datatype and byte order. |
| 6 | Output | Configure local file storage or server delivery. |
| 7 | Deploy | Save/apply and monitor the device/logs. |
2. Output Configuration & Data Delivery
Configure where Modbus Master stores collected data and how it delivers that data to an external platform. The current UI supports local CSV storage, third-party server delivery using HTTP(s), MQTT or TCP/IP, optional TLS and credentials, JSON payload formatting, data archival, and FTP/FTPS file transfer.
2.1 Output Configuration Overview
The Output Config page controls two independent output paths: local file storage and server delivery. Local file storage is enabled with Save Data to File. Server delivery is enabled with Send Data to Server. When server delivery is enabled, the current UI exposes a third-party platform selector and the protocol choices HTTP(s), MQTT, and TCP/IP.
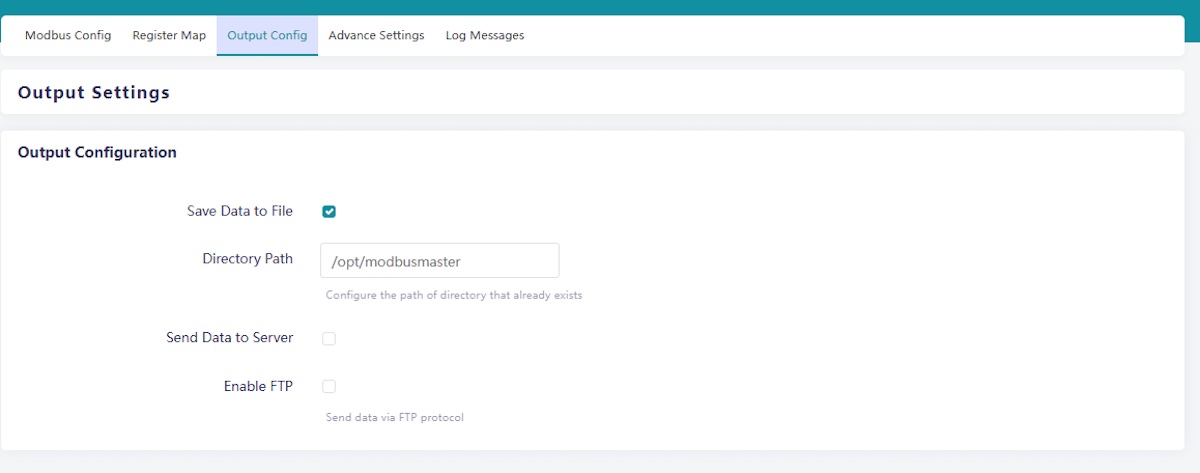
Basic output settings and local storage
| Setting | Purpose | Implementation behavior |
|---|---|---|
| Save Data to File | Enables local CSV storage. | When enabled, the configured directory is used for local data files. |
| Directory Path | Local directory for saved data. | The UI expects an existing directory and validates it as a directory path. |
| Send Data to Server | Enables external server delivery. | Protocol-specific server settings become available. |
| Connect To | Selects the output destination type. | The current UI exposes 3rd-PARTY-PLATFORM. |
2.2 Save Data to File
Enable Save Data to File and provide a directory path. The backend writes CSV data for each slave and keeps a stable column order based on the parameter list. A new file receives a header row before data rows are appended.
| CSV structure | The generated CSV starts with SerialID, followed by configured parameter columns, then slaveID, slavename, status, and timestamp. |
| Timestamp | File timestamps are written as 02-01-2006 15:04:05 by the supplied Go file-storage code. |
Storage planning: Use a directory with sufficient free space and monitor storage usage on the OpenWrt device, especially when local file saving is enabled for long-running installations.
2.3 Send Data to Server
When Send Data to Server is enabled, choose the required protocol. The UI currently exposes three third-party delivery methods.
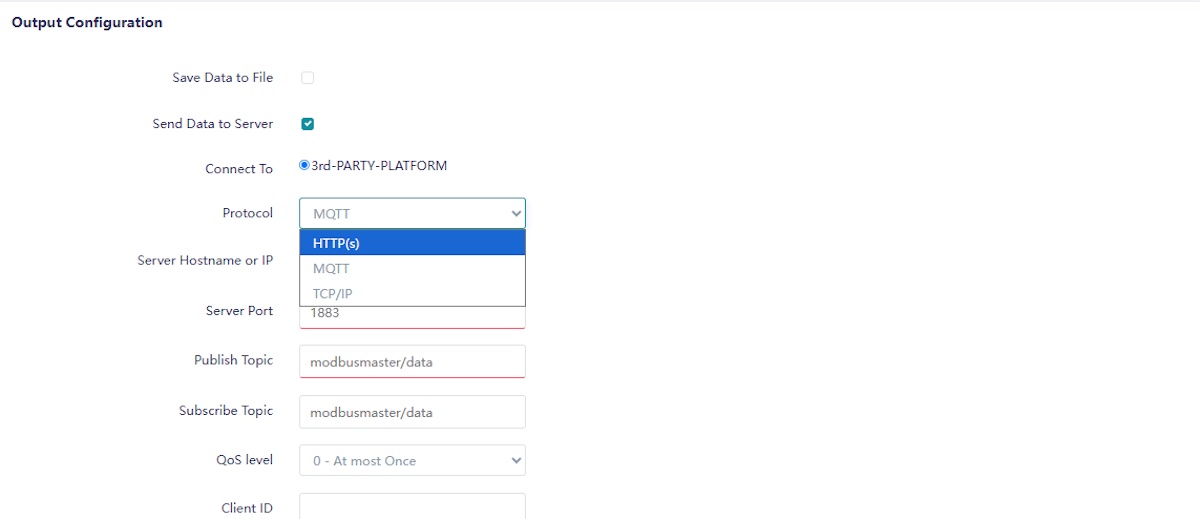
Available server protocol choices
| Step | Stage | What happens |
|---|---|---|
| 1 | Collect | Modbus polling produces parameter data. |
| 2 | Format | Payload settings determine the outgoing JSON representation. |
| 3 | Deliver | HTTP(s), MQTT or TCP/IP sends the resulting payload. |
| 4 | Archive / Retry | Archive data can be retained and retried when delivery is unavailable. |
2.4 HTTP(s) Delivery
Select HTTP(s) to send the generated JSON as an HTTP POST request. Configure the destination URL and optional HTTP headers. The supplied backend creates a POST request with the generated JSON body, applies the configured headers, optionally adds HTTP Basic Authentication, and accepts only a 2xx response as a successful send.
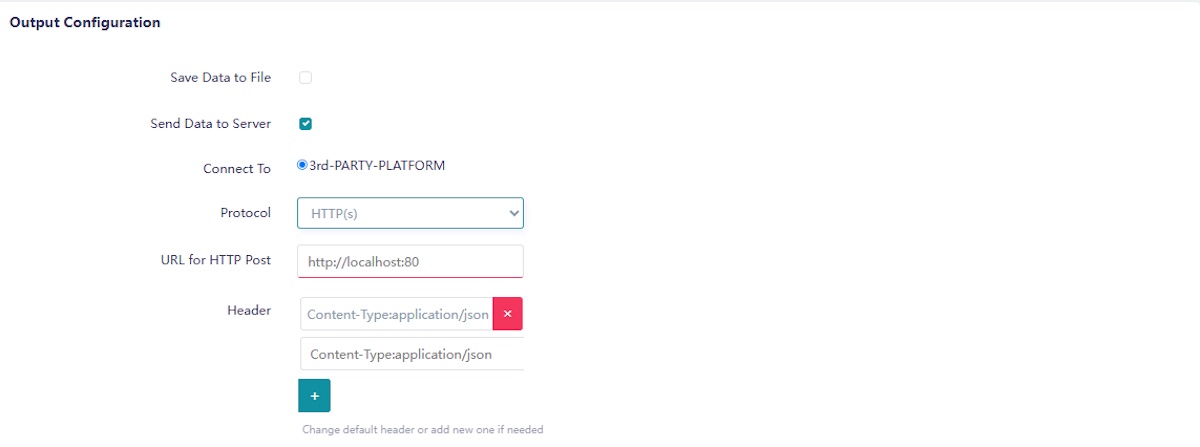
HTTP(s) configuration
| Field | What to configure |
|---|---|
| URL for HTTP Post | Complete destination URL that receives the JSON POST request. |
| Header | One or more headers such as Content-Type:application/json. |
| Use Certificate based TLS | Enables the UI's certificate-based TLS options for HTTP output. |
| Use Credentials | Provides username/password credentials; the backend applies HTTP Basic Authentication when credentials are configured. |
2.5 MQTT Delivery
Select MQTT to publish the generated JSON to a configured MQTT topic. Set the broker hostname or IP address, broker port, publish topic, optional subscribe topic, QoS level and optional client ID. The supplied publish function verifies that the MQTT client connection is open and waits up to three seconds for the publish token to complete.
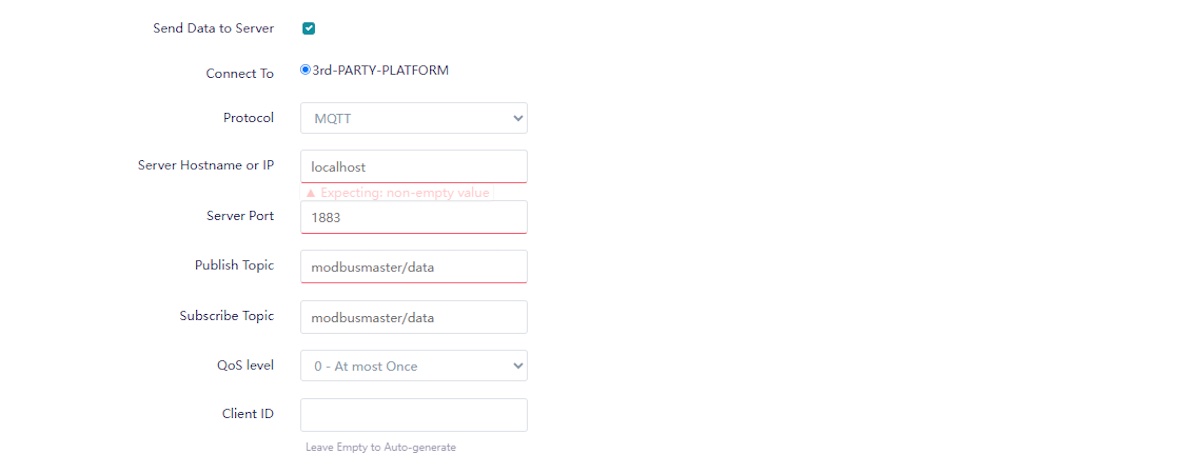
MQTT broker and topic settings
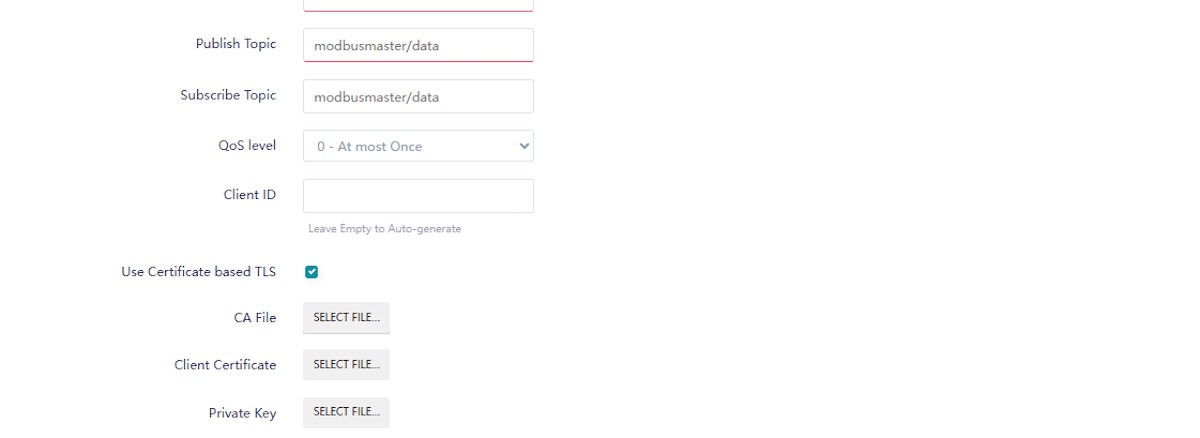
MQTT with certificate-based TLS options
| Field | Supported values / behavior |
|---|---|
| Server Hostname or IP | MQTT broker hostname or IP address. |
| Server Port | Broker TCP port; the UI example uses 1883. |
| Publish Topic | Topic used by the backend publish operation. |
| Subscribe Topic | UI field available for subscription configuration. |
| QoS level | 0 = At most Once, 1 = At least Once, 2 = Exactly Once. |
| Client ID | Optional; leaving it empty allows automatic generation according to the UI guidance. |
Implementation note: The supplied server-send function publishes to the configured Publish Topic. The provided output snippet does not show a subscribe operation.
2.6 TCP/IP Delivery
Select TCP/IP to send the generated JSON over an established TCP connection. Configure the server hostname or IP address and server port. The supplied backend writes the JSON bytes directly to the configured TCP client connection.
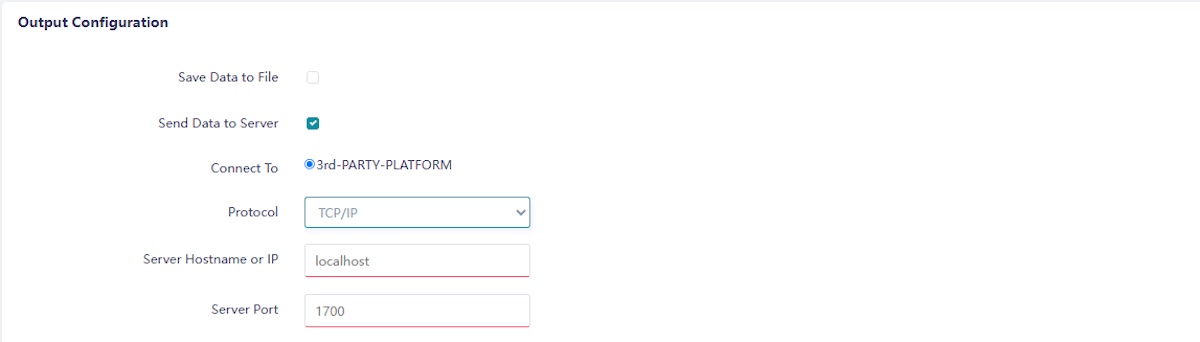
TCP/IP output configuration
TCP/IP is different from Modbus TCP. This output setting controls where the Modbus Master application sends its collected data. It is not the same connection used to poll a Modbus TCP slave.
2.7 TLS & Credentials
Certificate-based TLS is exposed in the current UI for HTTP(s) and MQTT. When TLS is enabled, the UI provides fields for a CA file, client certificate and private key. Certificate files are uploaded under /etc/modbusmaster. Username/password credentials are separately available for HTTP(s) and MQTT.
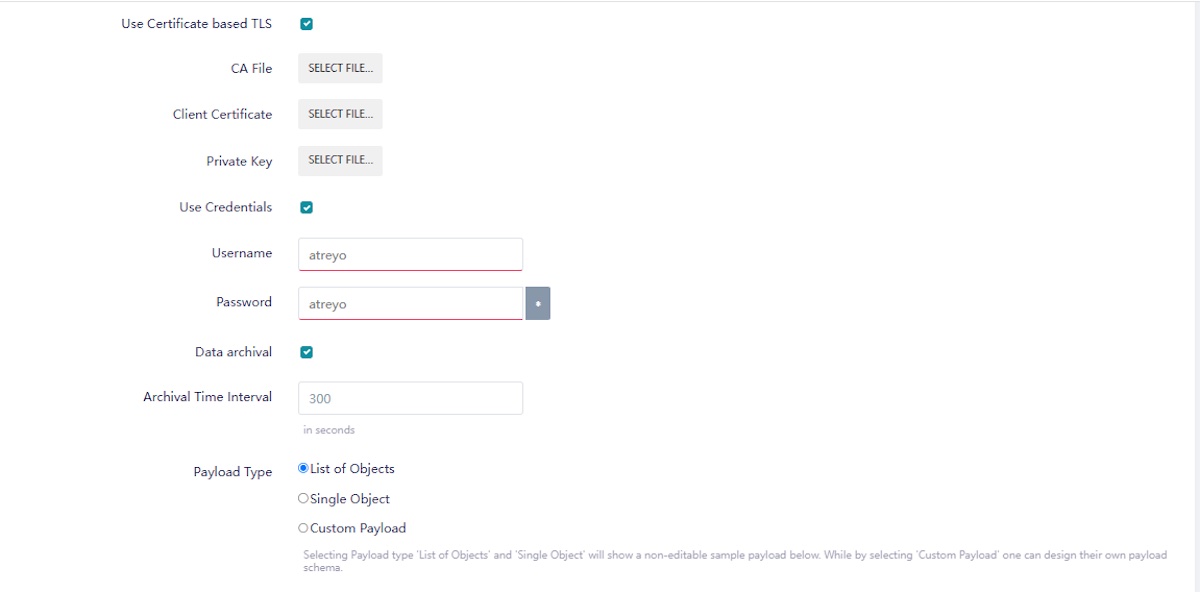
TLS certificates, credentials and archival options
| Security item | UI behavior |
|---|---|
| CA File | Uploads a CA certificate used by the configured TLS client. |
| Client Certificate | Uploads a client certificate for certificate-based authentication. |
| Private Key | Uploads the private key paired with the client certificate. |
| Username / Password | Optional credentials for HTTP(s) and MQTT output. |
Certificate verification matters. The backend's FTPS TLS configuration explicitly keeps certificate verification enabled and can load a configured CA certificate. Use a CA and server certificate that match the server identity and trust chain expected by the device.
2.8 Data Archival & Recovery
The output page exposes Data archival and an Archival Time Interval. The supplied backend uses LevelDB under /opt/archive/modbusmaster to retain archived payload data. Each archived record is marked with status = "archive" before being stored.
| Archive creation | When the sending path cannot use the normal online delivery route, archive data can be retained for later delivery. The archive retry loop checks pending records at the configured archival interval. |
| Successful delivery | For HTTP, MQTT and TCP/IP archive delivery, the backend deletes an archived record only after a successful send. Failed records remain available for a later retry. |
For file-based FTP/FTPS delivery, the supplied service also preserves files when uploads fail and deletes them only after a successful upload. When internet connectivity is restored, pending data is sent before normal current-data storage resumes.
2.9 Payload Types & Timestamp Formats
The UI provides three payload representations for third-party server output: List of Objects, Single Object, and Custom Payload. The timestamp can be represented in seconds, milliseconds, microseconds or nanoseconds.
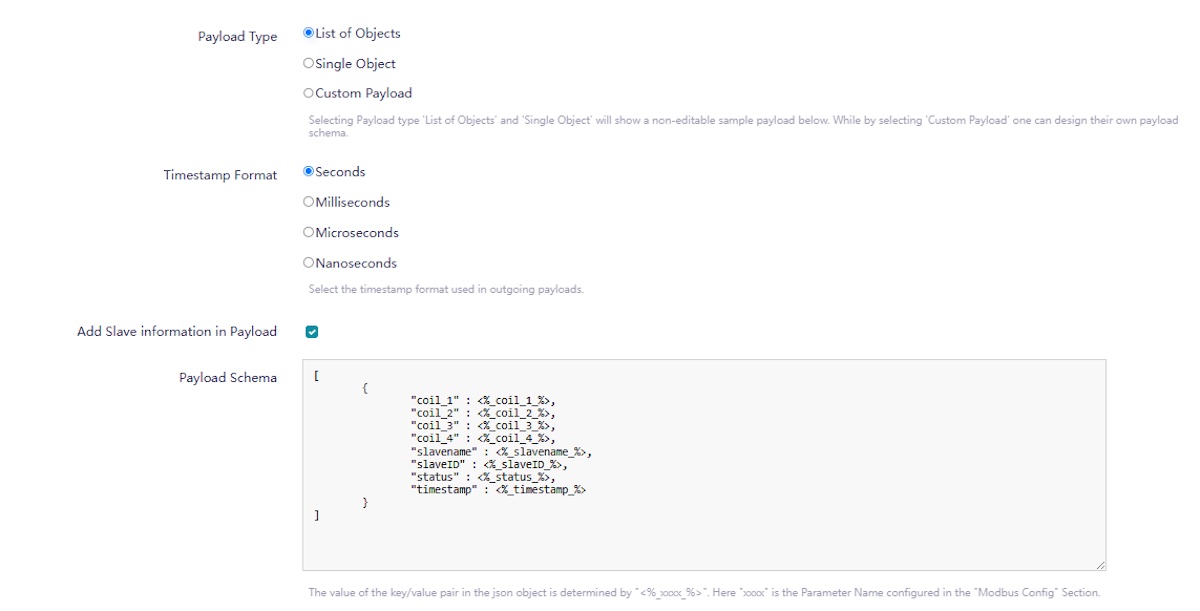
List of Objects payload options and generated schema
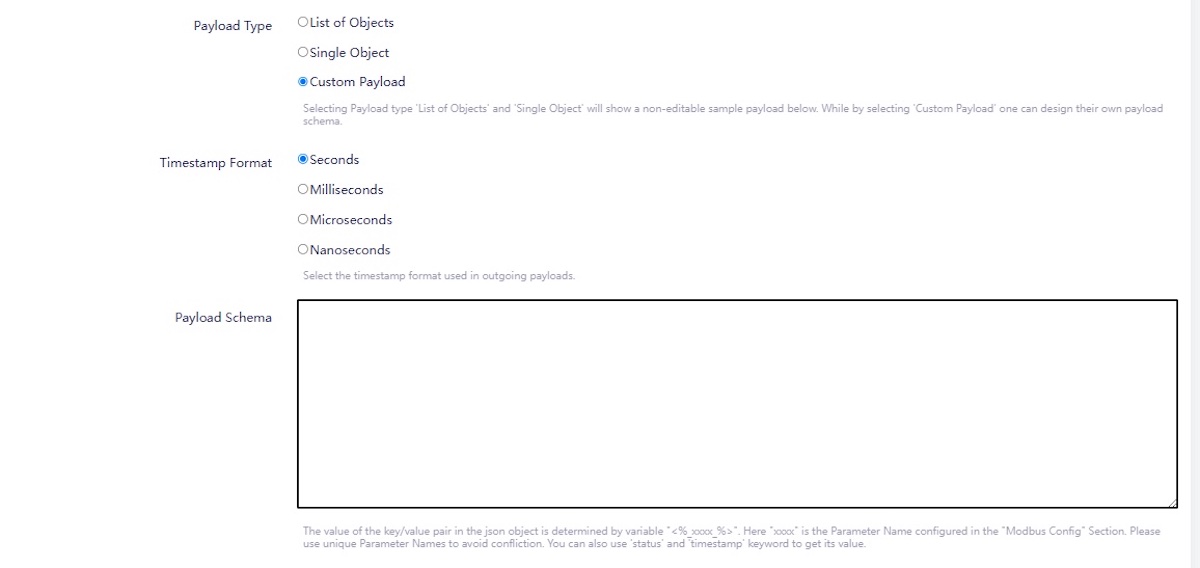
Custom Payload editor
| Payload Type | Meaning in the current implementation |
|---|---|
| List of Objects | Produces an array-style payload containing one object per slave context used by the schema generator. |
| Single Object | Produces one JSON object containing mapped values plus status/timestamp fields. |
| Custom Payload | Lets the user design a JSON structure using parameter placeholders. |
| Timestamp Format | Value unit |
|---|---|
| Seconds | Unix timestamp in seconds. |
| Milliseconds | Unix timestamp in milliseconds. |
| Microseconds | Unix timestamp in microseconds. |
| Nanoseconds | Unix timestamp in nanoseconds. |
2.10 Payload Schema & Parameter Placeholders
The generated payload schema is built from the configured Modbus parameter maps and static maps. A parameter is referenced using the placeholder form <%_parameter_name_%>. The UI generates the list/object schema from configured parameter and static entries, and the custom payload editor stores the user-defined schema.
Parameter naming: Use unique parameter names. The UI documentation explicitly warns that duplicate parameter names can cause conflicts when placeholders are resolved.
2.11 FTP & FTPS Delivery
FTP/FTPS is file-based delivery and is configured separately from HTTP(s), MQTT and TCP/IP. Enable FTP, optionally enable FTPS (SSL/TLS), then configure the server hostname/IP, server port, username, password and remote directory.
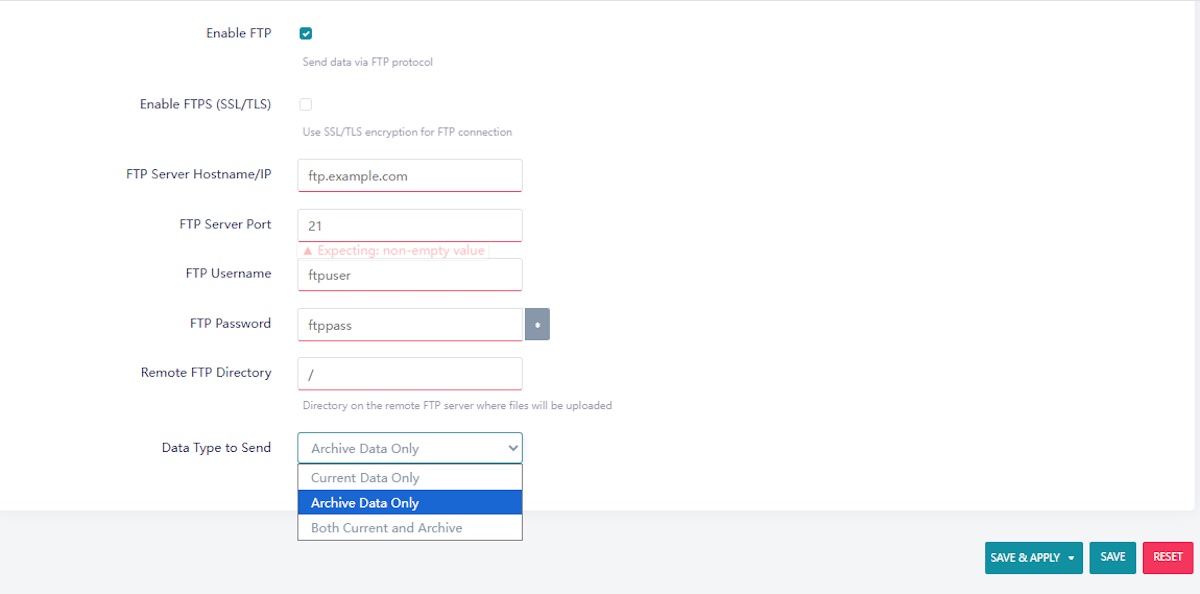
FTP data type selection and server settings
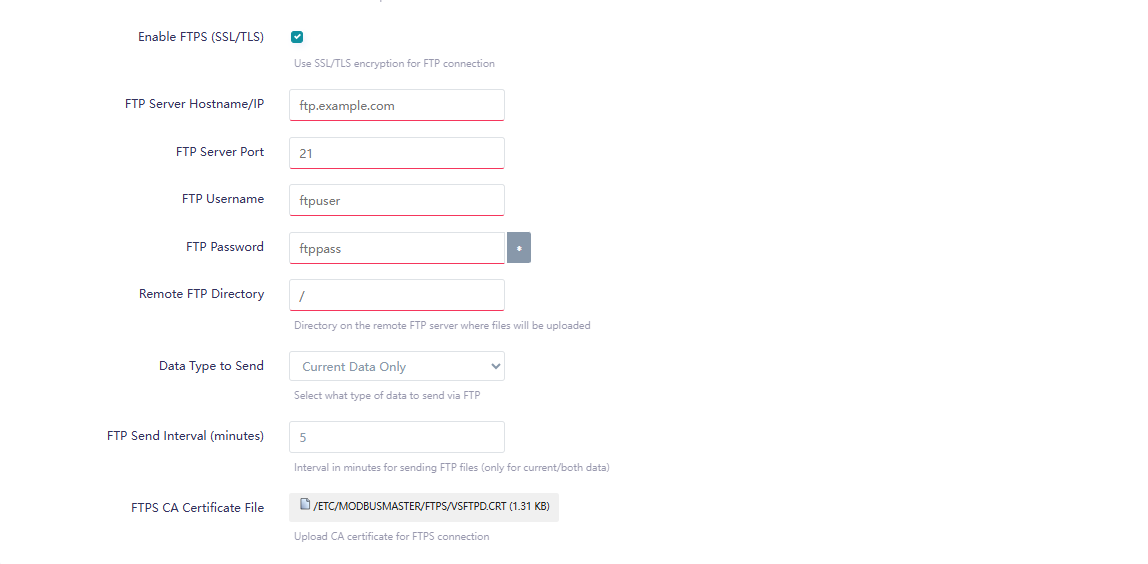
FTPS settings with CA certificate and send interval
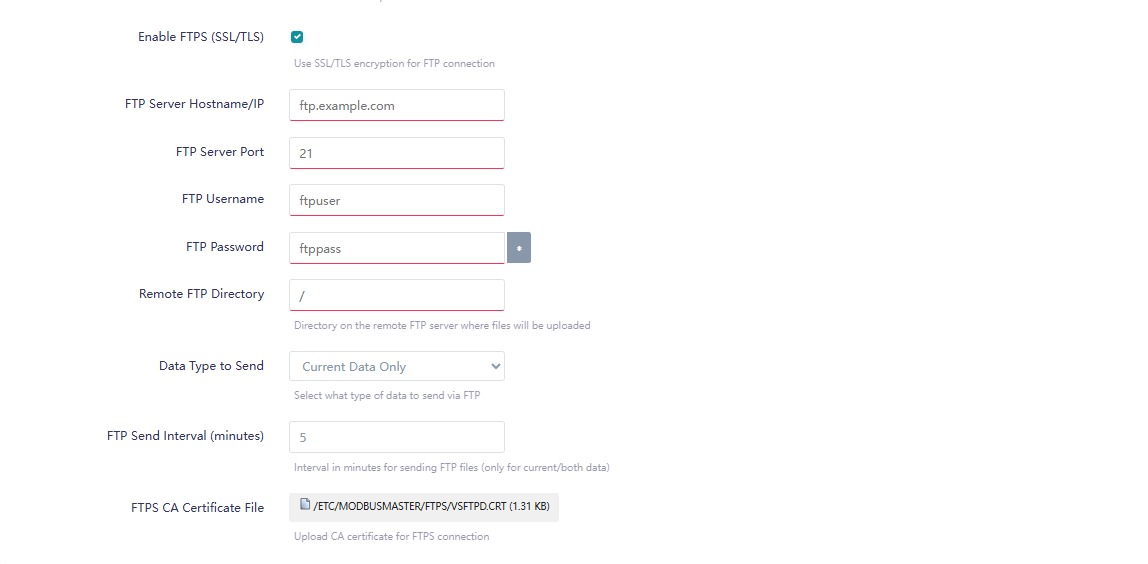
FTPS enabled configuration
| FTP setting | Behavior |
|---|---|
| Enable FTP | Enables FTP/FTPS file transfer. |
| Enable FTPS (SSL/TLS) | Uses explicit TLS for the FTP connection in the supplied Go implementation. |
| FTP Server Hostname/IP | FTP server host or IP address. |
| FTP Server Port | FTP server port; UI default is 21. |
| Remote FTP Directory | Remote directory where uploaded files are placed. |
| Data Type to Send | Current Data Only, Archive Data Only, or Both Current and Archive. |
| FTP Send Interval (minutes) | Controls the interval for current-data uploads when current or both data modes are selected. |
| FTPS CA Certificate File | CA certificate used to build the trusted TLS certificate pool. |
FTP data modes
| Mode | Behavior |
|---|---|
| Current Data Only | Uploads the current CSV file according to the configured send interval. |
| Archive Data Only | Sends pending archive CSV files when internet connectivity is available. |
| Both Current and Archive | Archive files are sent when available; current files follow the configured send interval. |
Upload safety: The supplied FTP service keeps a file when an upload fails and deletes it only after a successful upload. This prevents a failed transfer from silently discarding the local file.
2.12 Output Data Flow
| Step | Stage | What happens |
|---|---|---|
| 1 | Modbus Poll | Read configured registers from each slave. |
| 2 | Build Data | Map values, status and timestamp into the application data model. |
| 3 | Build Payload | Apply list, object or custom payload formatting. |
| 4 | Choose Output | Local CSV, HTTP(s), MQTT, TCP/IP, FTP or FTPS. |
| Online server delivery | JSON is generated and delivered through the selected HTTP(s), MQTT or TCP/IP path. Successful archive records are removed after delivery; failed archive records remain for retry according to the backend logic. |
| FTP / FTPS delivery | Current and archive CSV files are transferred as files. The service checks internet availability, keeps failed files locally, and removes a file only after a successful upload. |
Recommended configuration order: first verify local file saving and payload contents, then test one server protocol, then enable TLS/credentials, and finally enable archival and FTP/FTPS behavior where the deployment requires offline recovery or file-based delivery.
2.13 Check Internet Connection
Before using server delivery (HTTP(s), TCP/IP) or FTP/FTPS, confirm that the gateway has internet access. In the OpenWrt/LuCI interface, open Status → Overview and check the internet status.
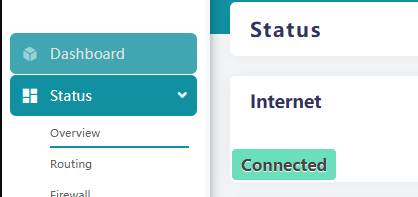
The internet status must show Connected. If it does not, data cannot be delivered to the server and will remain stored locally (archive) until the connection is restored.
2.14 MQTT Write & Payload from Server
Besides publishing data, the server can send a write command to Modbus Master over MQTT. The server publishes a JSON payload to the MQTT topic configured in the Subscribe Topic field, and Modbus Master writes the given value to the named parameter of the named slave.
| Key | Description |
|---|---|
command |
Must be "true" to make the write request active. |
slavename |
Name of the configured Modbus slave device that will receive the write. |
<parametername> |
Name of the configured parameter to write. Replace it with the actual parameter name, and set the value to write. |
Note: slavename and the parameter name must exactly match the names configured in Modbus Master.
3. Register Map & Data Mapping
Data Mapping creates a source-to-destination relationship between parameters of Modbus slaves. The source value is read by the normal polling process, and when that value changes, the mapping engine writes the new value to the selected destination slave parameter.
3.1 Data Mapping Overview
The Register Map page is shown as Data Mapping in the UI. Each mapping contains four fields: Source Slave, Source Parameter, Destination Slave, and Destination Parameter.
| Source | The slave and parameter whose current Modbus value is used as the input value for the mapping. |
| Destination | The slave and parameter that receives the source value when the source value changes. |
Key behavior: Slave 1 / Coil_1 mapped to Slave 2 / Coil_2 means the application writes the current Coil_1 value from Slave 1 into Coil_2 on Slave 2 when a change is detected.
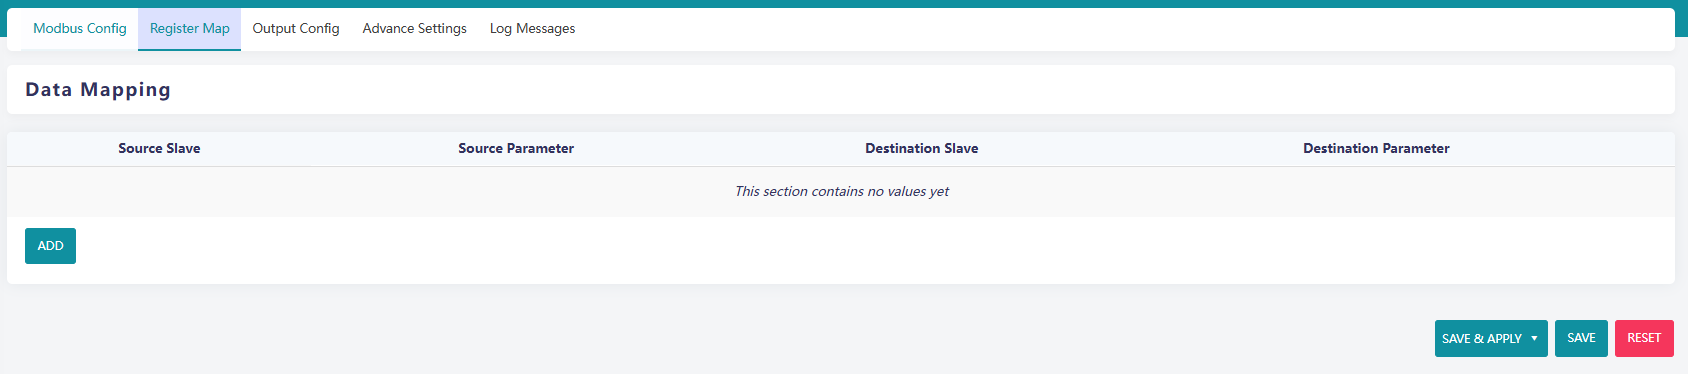
Register Map — Data Mapping page with source and destination selections.
3.2 Create a Mapping
Click ADD to create a new mapping entry. The UI automatically creates section names such as mapping_1, mapping_2, and so on.
| Step | Stage | What happens |
|---|---|---|
| 1 | Add | Create a new mapping row. |
| 2 | Source Slave | Select the slave providing the value. |
| 3 | Source Parameter | Select the source parameter. |
| 4 | Destination | Select the destination slave and parameter. |
| 5 | Save | Save after all four fields are complete. |
Validation: the UI refuses to save if any mapping is missing a source slave, source parameter, destination slave, or destination parameter.
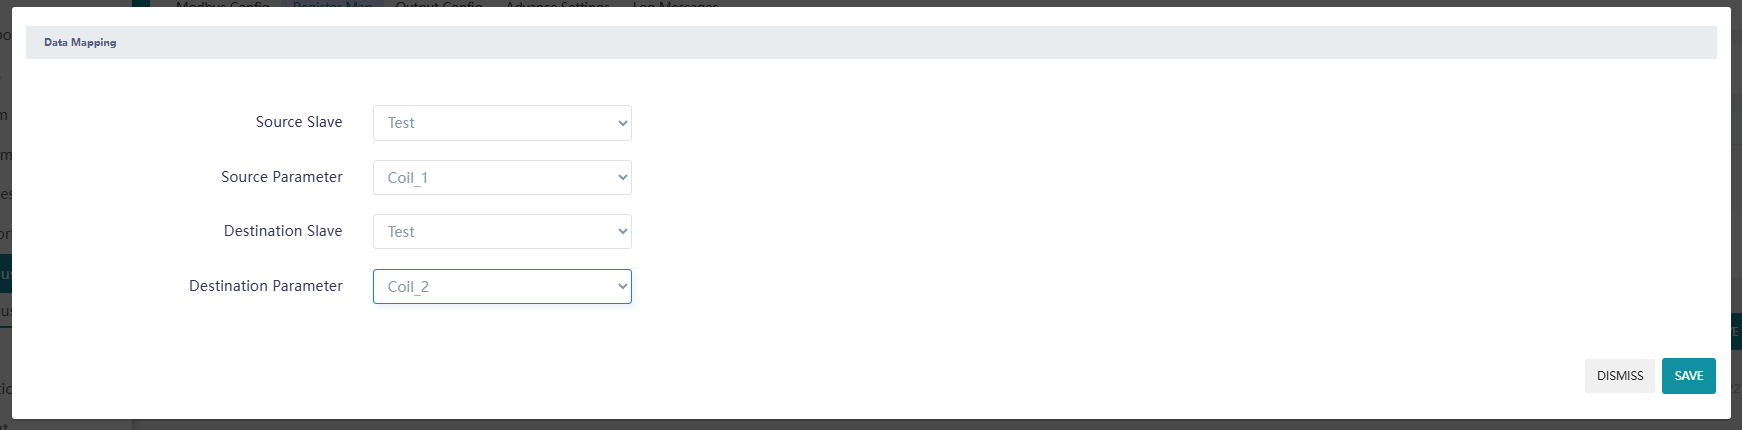
Data Mapping — select source slave/parameter and destination slave/parameter.
3.3 Select Source Slave & Parameter
The Source Slave list is populated from the configured Modbus Master slave devices. After a source slave is selected, the Source Parameter list is populated from that slave's configured parameter mappings.
| Field | How it is populated | Role |
|---|---|---|
| Source Slave | Configured slaveconfig entries. |
Identifies the device providing the value. |
| Source Parameter | Parameter mappings belonging to the selected source slave. | Identifies the value that will be copied. |
3.4 Select Destination Slave & Parameter
The Destination Slave list uses the same configured slave list. Selecting the destination slave populates Destination Parameter from that slave's configured parameter mappings.
| Field | Role |
|---|---|
| Destination Slave | The device that receives the write. |
| Destination Parameter | The configured parameter that receives the copied value. |
The destination does not have to appear in the current parameter-read result for the backend to attempt the write. The mapping engine delegates the actual write target resolution to modbuswrite.SetQuery().
3.5 How Register Mapping Works
Register mapping is processed automatically after each normal parameter-reading cycle. The application first completes its regular Modbus read operation and builds the current set of parameter values. The mapping engine then checks every configured source-to-destination mapping.
| Step | Stage | What happens |
|---|---|---|
| 1 | Read | Normal polling obtains the latest parameter values. |
| 2 | Find Source | The configured source slave and source parameter are located. |
| 3 | Compare | The current source value is compared with the previously handled value. |
| 4 | Write | A changed value is sent to the configured destination parameter. |
| 5 | Remember | The source value is remembered only after a successful write. |
Important: Register Mapping does not perform a second read cycle. It uses the values already collected by the normal polling process and then performs a write only when the configured source value has changed.
3.6 Change Detection & Write Behavior
Each mapping keeps track of the last source value that was successfully written. When the next polling cycle produces the same value, the mapping is skipped and no new write is issued.
| Condition | Mapping behavior |
|---|---|
| First value observed | The value is treated as the initial source value and a destination write is attempted. |
| Source value changed | The new value is written to the configured destination slave and parameter. |
| Source value unchanged | The mapping is skipped for that cycle, avoiding a duplicate write. |
| Destination write fails | The failed value is not marked as successfully handled, so the application can retry it on a later polling cycle. |
The current implementation passes the source value to the destination without applying scaling or other transformations. The supplied backend contains a future extension point for transformations such as scaling, offset, clamping and deadband, but those transformations are not active in the current mapping flow.
Why change detection matters: it prevents the same destination value from being written repeatedly when the source parameter has not changed.
3.7 Practical Example: Slave 1 → Slave 2
Suppose the mapping is configured as shown below:
| Mapping field | Configured value |
|---|---|
| Source Slave | Slave 1 |
| Source Parameter | Coil_1 |
| Destination Slave | Slave 2 |
| Destination Parameter | Coil_2 |
During a normal polling cycle, the application reads the current value of Slave 1 / Coil_1. Assume the value changes from 0 to 1. The mapping engine detects that change and sends the value 1 to the configured destination, Slave 2 / Coil_2.
| Step | Stage | What happens |
|---|---|---|
| 1 | Read Slave 1 | Current Coil_1 value is obtained by the normal polling cycle. |
| 2 | Detect Change | The new value differs from the previous successful value. |
| 3 | Prepare Write | The same source value is selected for the destination parameter. |
| 4 | Write Slave 2 | Slave 2 / Coil_2 receives the value 1. |
| 5 | Remember Value | The value is stored as successfully handled for the next cycle. |
Result: when Slave 1 / Coil_1 changes to 1, Slave 2 / Coil_2 is written with 1. If Coil_1 remains 1 on subsequent cycles, the mapping does not repeatedly write the same value.
The actual destination write is delegated to the existing Modbus write layer, which resolves the destination slave and parameter using the device configuration. This means the destination can be a valid write target even when it is not present in the current read-result list.
3.8 Mapping Troubleshooting
| Situation | What to check |
|---|---|
| Mapping will not save | Confirm all four fields are selected. |
| No write occurs | Confirm the source parameter exists in the polling result and its value has changed. |
| Write fails repeatedly | Check destination communication settings and destination parameter write capability. |
| Repeated writes | Check whether the source value is actually changing between cycles. |
| Destination not in read result | The backend can still attempt the write because destination resolution is delegated to the write layer. |
4. Alerts & Trigger Automation
Use the Alerts and Triggers configuration to define condition-based notifications and device-to-device actions. The current UI lets you select a Modbus slave and parameter, compare the parameter with a configured value, and then either send an alert notification or define an output action through a trigger.
4.1 Alerts & Triggers Overview
The Advance Settings page contains two configuration areas: Alerts and Triggers. Alerts evaluate a selected parameter against a comparison value and can use SMS and/or E-mail notification channels. Triggers evaluate an input condition and define an output condition for a selected output slave.
| Alerts | An alert is based on one slave parameter and a comparison operator such as ==, <, <=, >, or >=. Notification recipients can be configured for SMS and/or E-mail. |
| Triggers | A trigger evaluates an input slave parameter and value, then defines an output slave parameter and output value. The input comparison supports the same ==, <, <=, >, and >= operators. |
Configuration model: both rule types are configured per selected Modbus slave. Parameter/tag lists are populated from the parameter mappings configured for the selected slave.
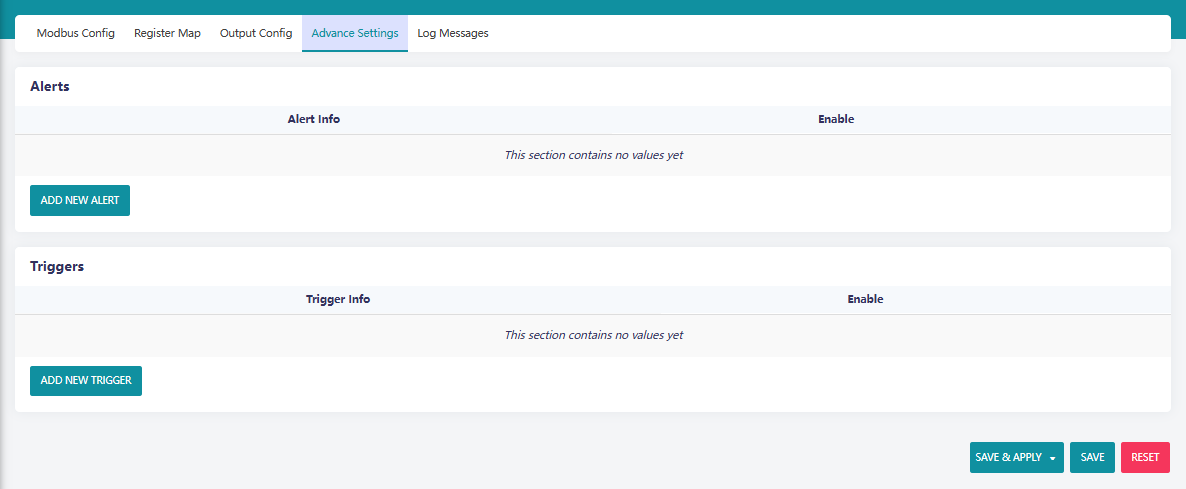
Advance Settings — Alerts and Triggers. Configure alert rules and trigger rules from this page.
4.2 Create an Alert
Click Add New Alert. The creation dialog first asks for the Slave Device used by the alert logic. After the alert is created, the full alert configuration becomes available.
- Select the Modbus slave whose parameter should be monitored.
- Create the alert.
- Configure the alert condition, notification type, recipients, and message.
- Enable the alert and save the configuration.
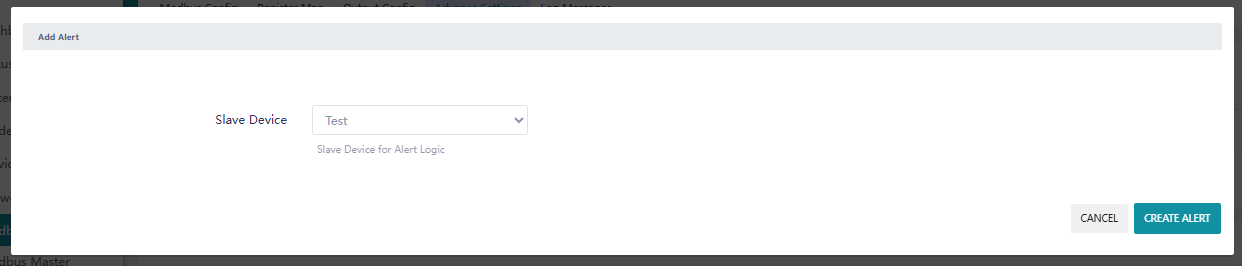
Add Alert — select the slave device used for the alert logic.
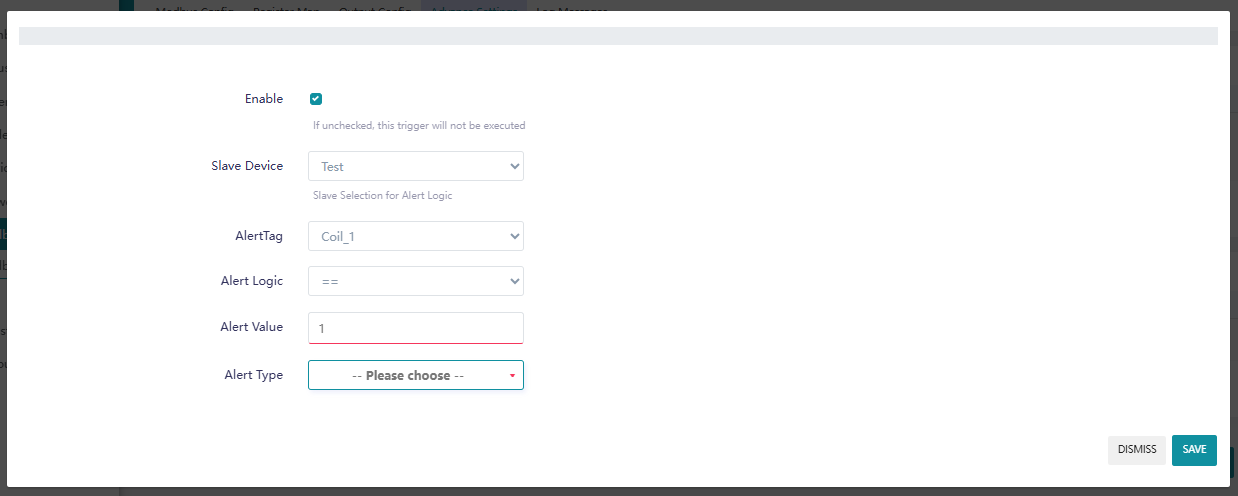
Alert configuration — enable the rule, select the slave and parameter, choose the comparison logic, and enter the alert value.
4.3 Configure Alert Conditions
| Field | Configuration |
|---|---|
| Enable | Controls whether the alert is active. The UI defaults this setting to enabled. |
| Slave Device | Selects the slave used by the alert condition. |
| AlertTag | Selects a parameter from the selected slave's configured parameter mappings. |
| Alert Logic | Choose ==, <, <=, >, or >=. |
| Alert Value | Value used by the selected comparison operator. The UI requires a non-empty numeric or hexadecimal-style value according to its validator. |
| Alert Type | Select SMS, E-mail, or both notification types. |
Example: Coil_1 of Test == 1 describes an alert condition where the selected Coil_1 parameter on slave Test is compared with the value 1.
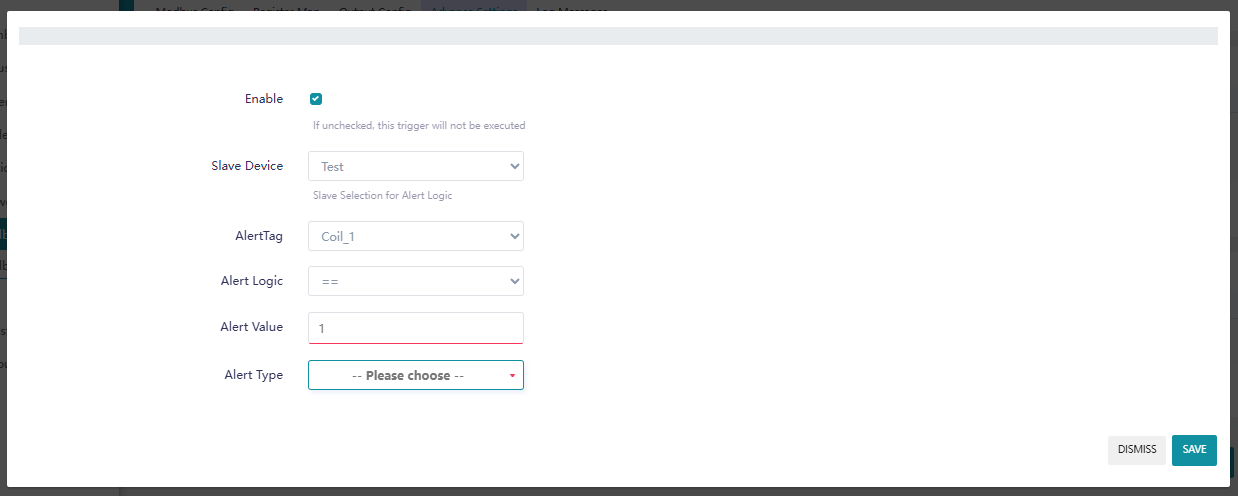
Alert condition example — the Alert Tag and Alert Logic determine the monitored condition.
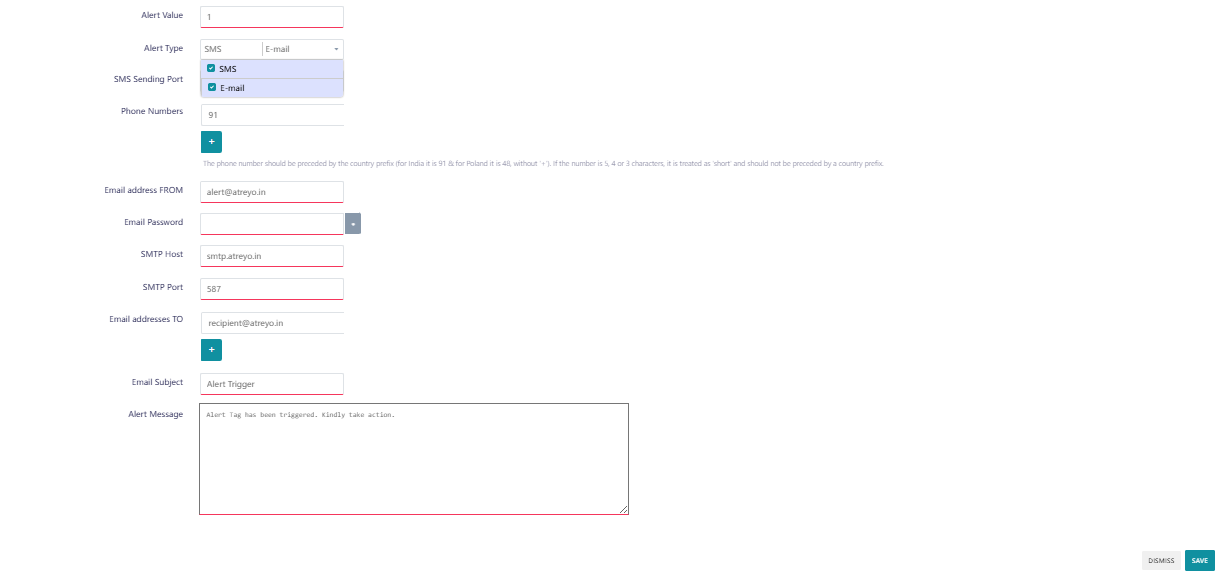
Alert Type — SMS and E-mail can be selected for the same alert.
4.4 SMS Notifications
When SMS is selected as an Alert Type, the UI exposes an SMS serial port and a dynamic list of phone numbers.
| Field | Purpose |
|---|---|
| SMS Sending Port | Select the serial device used for SMS delivery. The UI enumerates /dev/ttyS* and /dev/ttyUSB* devices. |
| Phone Numbers | Add one or more destination numbers. The UI documentation asks for the country prefix without the + character for normal-length numbers. |
| Alert Message | Text that will be associated with the alert notification. |
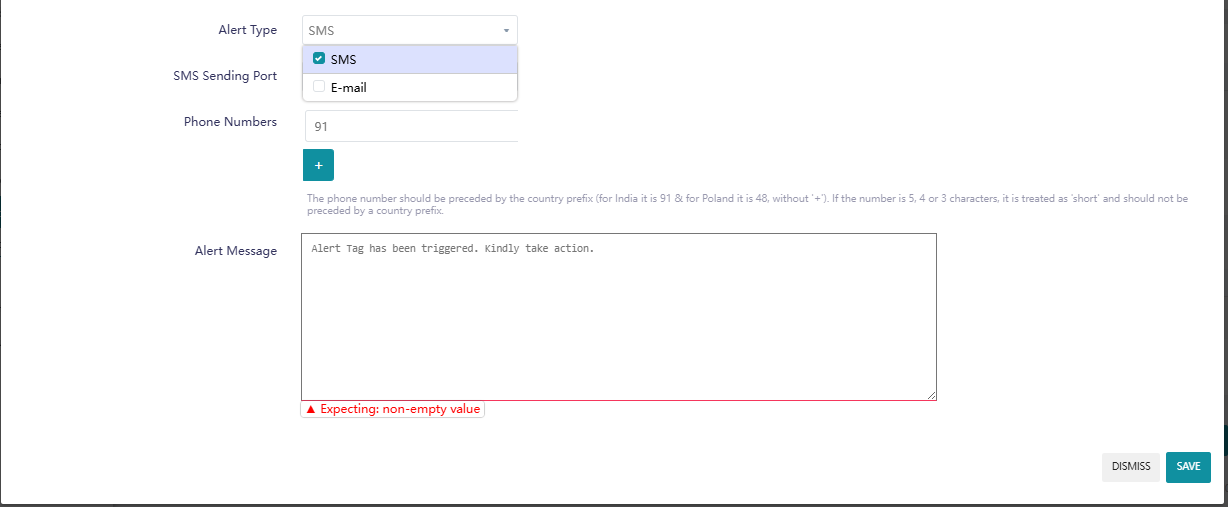
SMS notification configuration — serial port, destination phone numbers and alert message.
4.5 E-mail Notifications
When E-mail is selected, the UI exposes SMTP sender, authentication, destination and subject settings.
| Field | Purpose |
|---|---|
| Email address FROM | Sender address. The UI validates the value as an e-mail address. |
| Email Password | Password associated with the sender account. |
| SMTP Host | SMTP server hostname or address. |
| SMTP Port | SMTP server port. The supplied UI uses 587 as its placeholder/default example. |
| Email addresses TO | One or more destination addresses. |
| Email Subject | Subject line for the alert message. |
| Alert Message | Message body for the notification. |
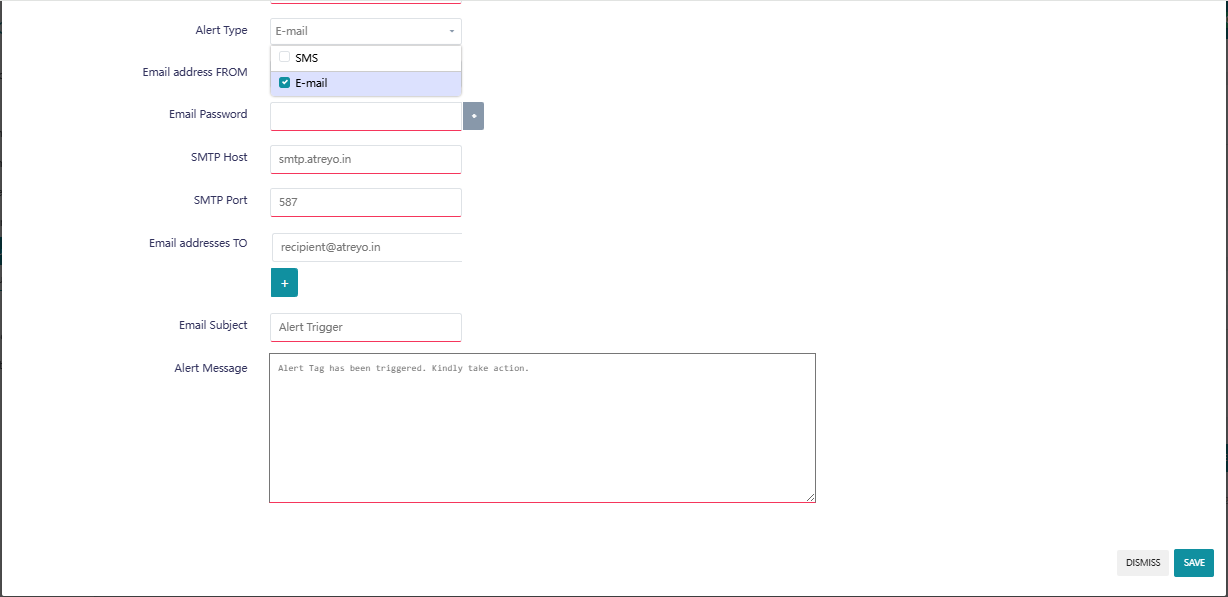
E-mail notification configuration — sender, SMTP server, recipients, subject and message.
4.6 Create a Trigger
Click Add New Trigger. The creation dialog asks for both an Input Slave Device and an Output Slave Device. This establishes the source and destination devices for the trigger logic.
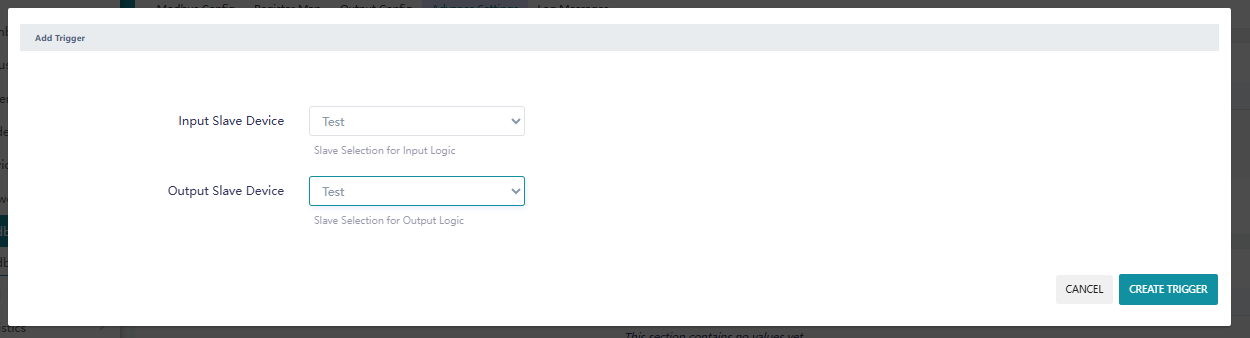
Add Trigger — select the input slave and output slave.
| Step | Stage | What happens |
|---|---|---|
| 1 | Select Input | Choose the slave containing the parameter to evaluate. |
| 2 | Compare Value | Select the input tag, operator and comparison value. |
| 3 | Select Output | Choose the output slave and output tag. |
| 4 | Write Output | Configure the output value applied when the trigger condition is met. |
4.7 Configure Trigger Logic
| Field | Configuration |
|---|---|
| Enable | Determines whether the trigger is executed. The UI defaults this setting to enabled. |
| Input Slave Device | Slave from which the trigger reads the input parameter. |
| Input Tag | Parameter selected from the input slave's configured mappings. |
| Input Logic | Choose ==, <, <=, >, or >=. |
| Input Value | Value used in the input comparison. |
| Output Slave Device | Slave on which the trigger's output action is defined. |
| Output Tag | Parameter selected from the output slave's configured mappings. |
| Output Logic | The current UI displays == for the output condition. |
| Output Value | Value associated with the output condition. |
Trigger model: IF input-tag of input-slave input-logic input-value then the trigger defines the selected output tag/value on the output slave.
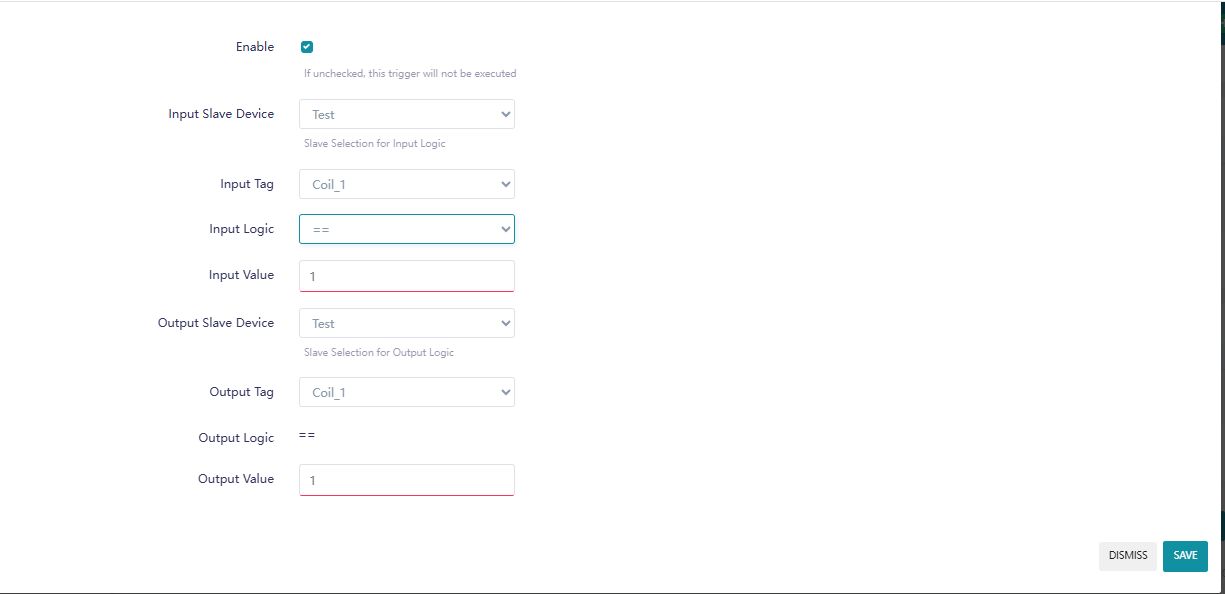
Trigger configuration — input condition and output action settings.
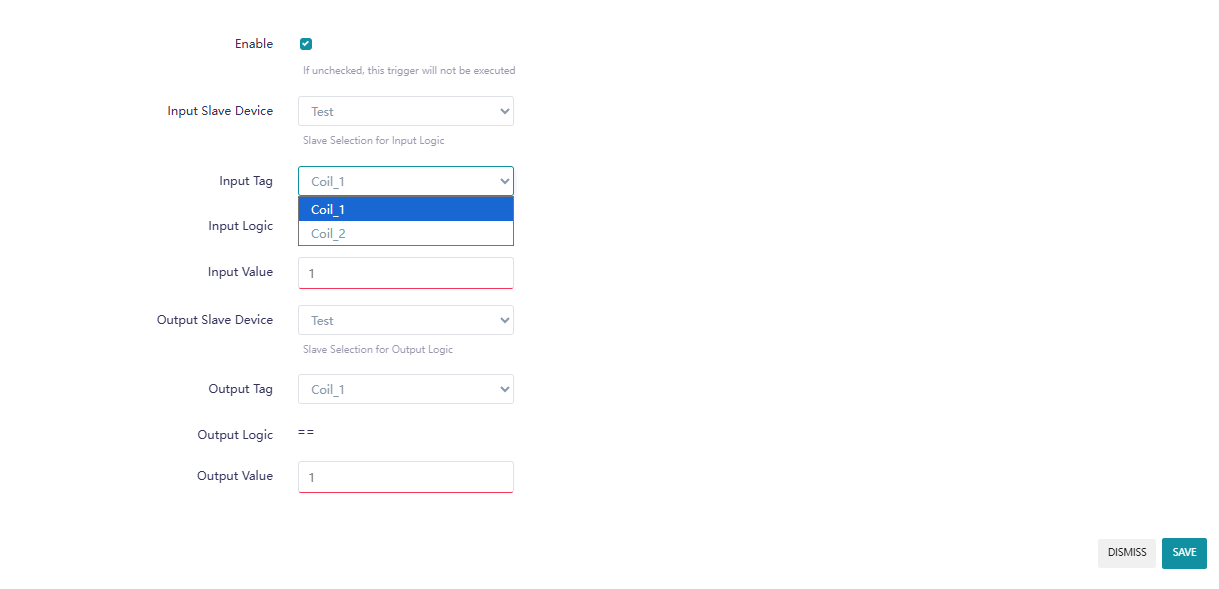
Input Tag — choose the parameter from the selected input slave.
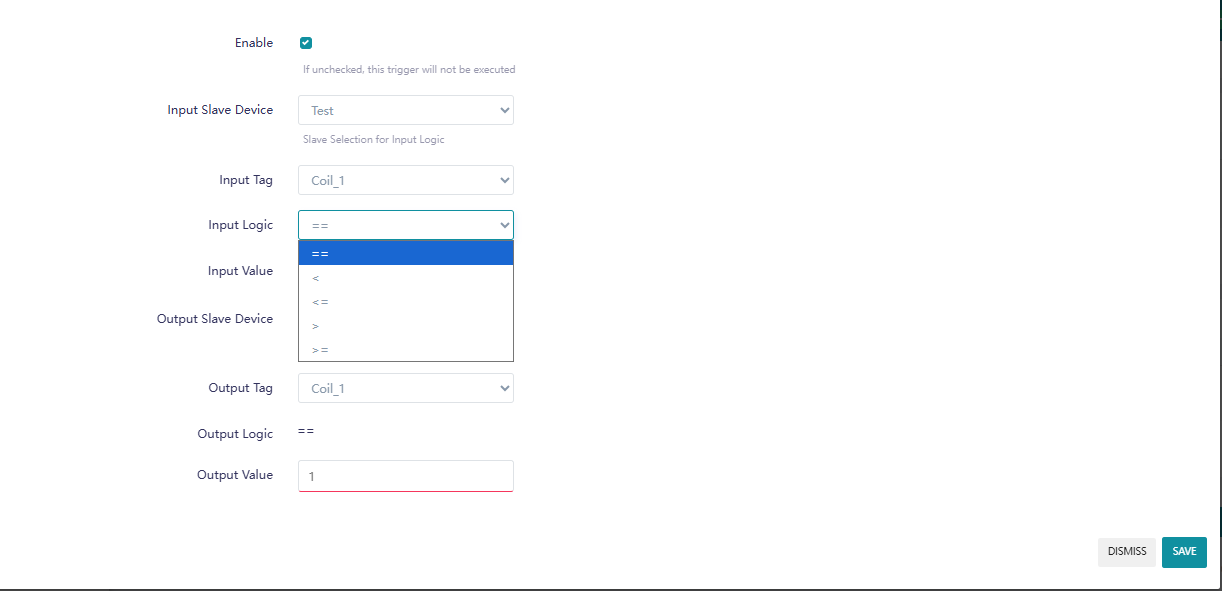
Input Logic — choose the comparison operator used by the trigger.
4.8 Enable, Edit & Manage Rules
The main Advance Settings page lists configured alerts and triggers. Each row shows a compact rule summary and an Enable control. The alert summary displays its condition plus SMS and E-mail recipient counts. The trigger summary displays the input condition and the output condition.
| Task | Action |
|---|---|
| Enable / Disable | Use the Enable checkbox in the list to control whether the rule is active. |
| Edit | Open the alert or trigger configuration and modify its device, tag, logic, values, or notification settings. |
| Remove | Remove the selected rule from the configuration list. |
| Pending changes | The UI can indicate that an alert or trigger has pending configuration changes. |
Implementation note: the supplied UI code defines the configuration fields and UCI objects for alerts and triggers. The runtime notification/action backend was not supplied with this UI source, so this guide does not claim details about the actual SMS, E-mail, or output-action execution beyond the configuration behavior exposed by the interface.
5. Log Messages & Diagnostics
The Log Messages page provides a live view of the Modbus Master application log. It is intended for runtime monitoring, communication diagnostics, configuration verification, and troubleshooting polling or backend errors.
5.1 Live Logs Overview
The Log Messages page contains a Live Logs heading, control buttons, and a dark log console. The console displays timestamped log entries together with severity labels such as [Info] and [Warn].
| What the page shows | Runtime messages generated by Modbus Master, including polling errors, file/FTP/FTPS initialization messages, configuration loading information, and other application events. |
| Why use Live Logs | Use the log view to verify that the application is running, identify communication timeouts, confirm configuration loading, and observe recovery or operational events. |
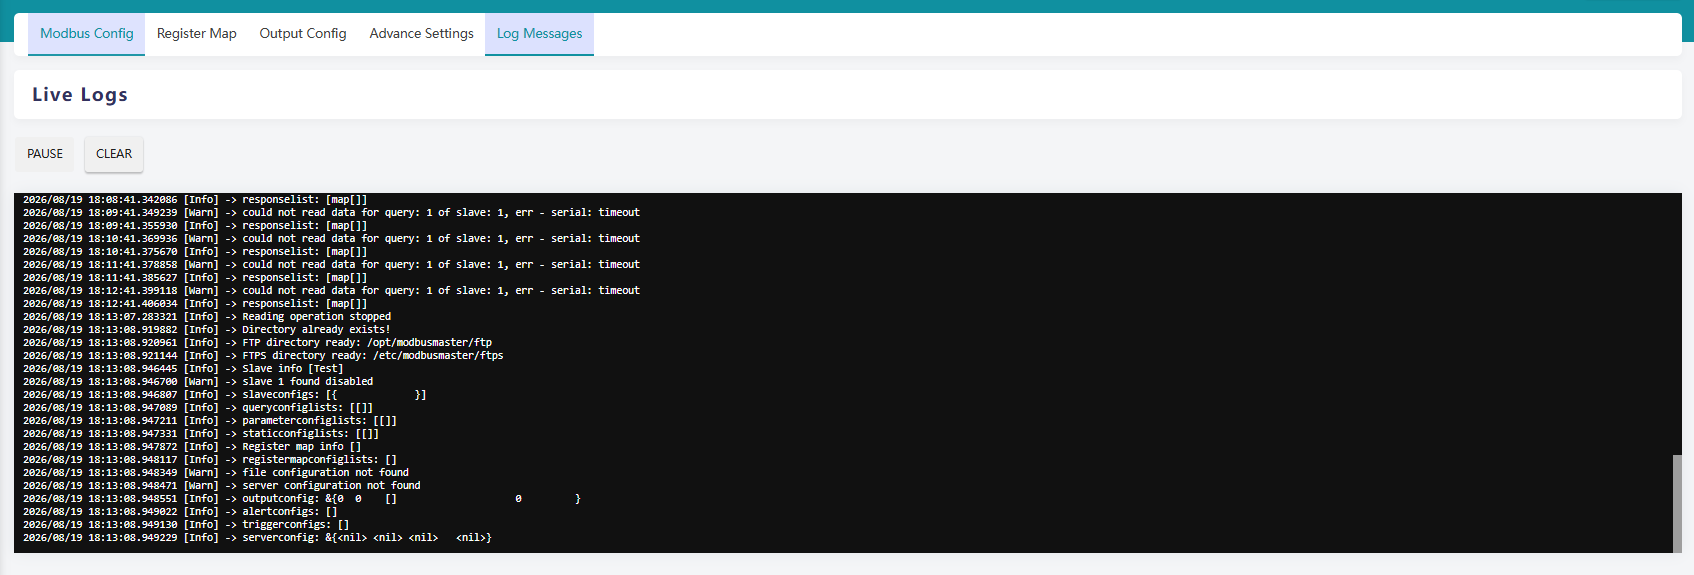
Live Logs — active log streaming with the Pause and Clear controls.
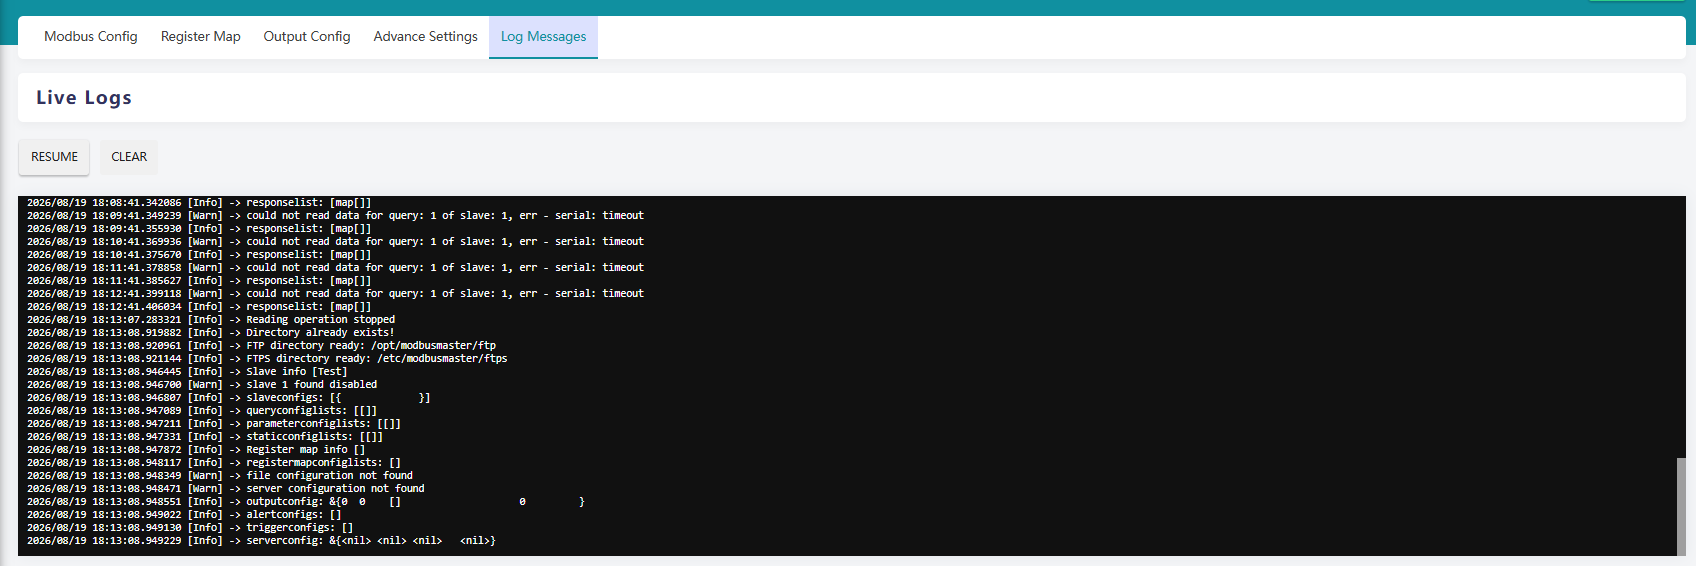
Live Logs — paused view with the Resume and Clear controls.
Severity: [Info] generally identifies informational events, while [Warn] identifies warning conditions that may require attention. The actual message text provides the operational context.
5.2 Pause, Resume & Clear
| Control | Behavior |
|---|---|
| Pause | Stops the UI from applying new polled log data to the visible log console. The log content already displayed remains available for inspection. |
| Resume | Re-enables the live log updates. The button label changes back to Pause. |
| Clear | Clears the currently displayed log text in the browser view. This control changes the visible console only; the supplied UI code does not show it deleting the backend log file. |
Recommended use: press Pause before reading a rapidly changing error sequence, then press Resume to return to live monitoring.
5.3 Log Display & Auto-Scroll
The UI renders the log output inside a scrollable console. When new log data is received, the view automatically moves to the bottom so the latest messages remain visible.
| Scrollable console | The log area is displayed as a fixed-height <pre> element with vertical scrolling enabled. |
| Latest messages first in view | After each successful poll, the UI sets the scroll position to the end of the log content. |
This behavior is implemented in the supplied Log Messages LuCI view.
5.4 Refresh & Monitoring Behavior
The supplied UI uses the LuCI poll facility and schedules the log retrieval function at a two-second interval.
Pause behavior: while paused, the polling callback returns without replacing the displayed log content.
5.5 Reading Common Log Messages
The Log Messages page can contain several different categories of entries. The examples below are based on the supplied screenshots.
| Example message | Meaning in the shown log |
|---|---|
could not read data for query: 1 of slave: 1, err - serial: timeout |
The application could not complete the Modbus serial query because the serial operation timed out. |
responseList: [map[]] |
A response-list object was logged during the operation. The exact payload content depends on the query/result being processed. |
Reading operation stopped |
The log indicates that the active reading operation was stopped. |
FTP directory ready: /opt/modbusmaster/ftp |
The application reports that its FTP working directory is ready. |
FTPS directory ready: /etc/modbusmaster/ftps |
The application reports that its FTPS configuration/certificate directory is ready. |
slaveconfigs: ... |
The application is logging the currently loaded slave configuration data. |
queryconfigs: ... |
The application is logging the query configuration currently loaded. |
server configuration not found |
The application did not find the expected server configuration at that point in its startup/configuration processing. |
alertconfigs: [] |
No alert configurations were loaded at the time this message was logged. |
triggerconfigs: [] |
No trigger configurations were loaded at the time this message was logged. |
Important: the meaning above is limited to what can be established from the supplied UI, screenshots, and displayed messages. The Log Messages UI itself retrieves the text from the modbusmasterlog.read RPC method; the backend implementation of that RPC method was not supplied here.
5.6 Using Logs for Troubleshooting
| Step | Stage | What happens |
|---|---|---|
| 1 | Pause | Stop the visible stream when the problem occurs so the relevant messages can be reviewed. |
| 2 | Locate the warning | Look for [Warn] messages and communication error text. |
| 3 | Check context | Review the messages immediately before and after the warning. |
| 4 | Resume | Continue live monitoring after the configuration or communication issue has been investigated. |
Example: serial timeout
For a message such as could not read data for query: 1 of slave: 1, err - serial: timeout, start by checking the selected serial interface, slave ID, baud rate, parity, stop bits, wiring and the slave's availability. The log identifies the failed query and timeout, but the supplied Log Messages source does not itself diagnose which physical/configuration cause produced the timeout.
Example: configuration loading
Messages such as slaveconfigs, queryconfigs, outputconfig, alertconfigs and triggerconfigs are useful for confirming what configuration the application loaded during startup or reinitialization.