Getting Started with Atra-RMS
📊
The DeviceOverview page is your command center in Atra RMS, offering a birds-eye view of your fleet and activity. From the navigation panel on the left, you can manage your Devices, VPN, Organizations, Users, and Roles. The panel also includes quick-access buttons to download the Atra VPN Client, view the Docs, or switch between light and dark modes via the theme toggle. For a cleaner view, you can collapse the panel using the icon at its top-right corner.
Device, VPN Tunnels & Organization Summary
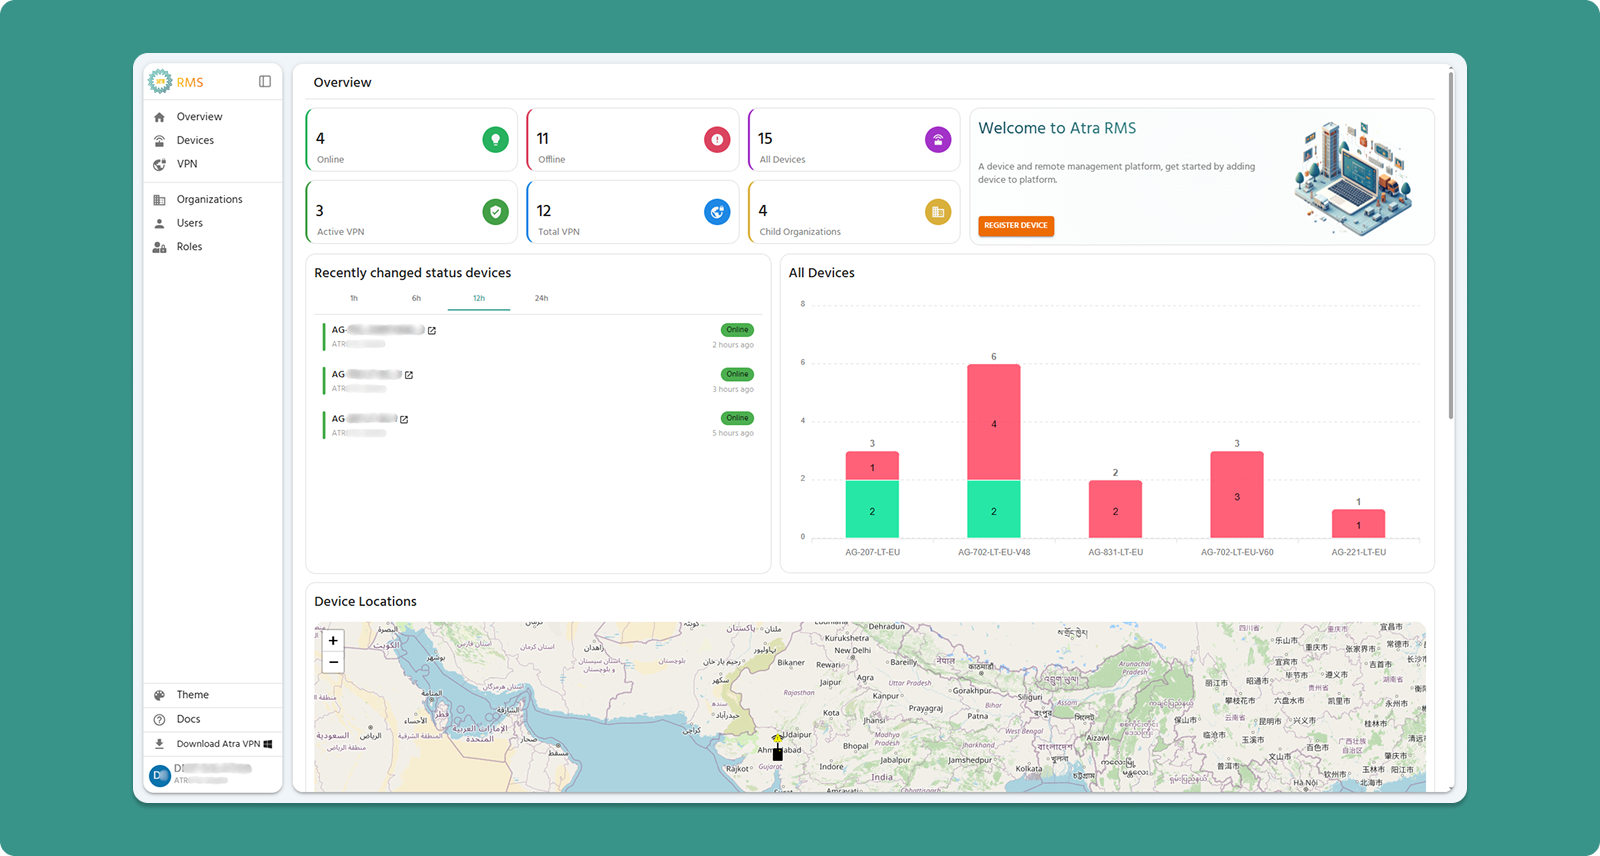
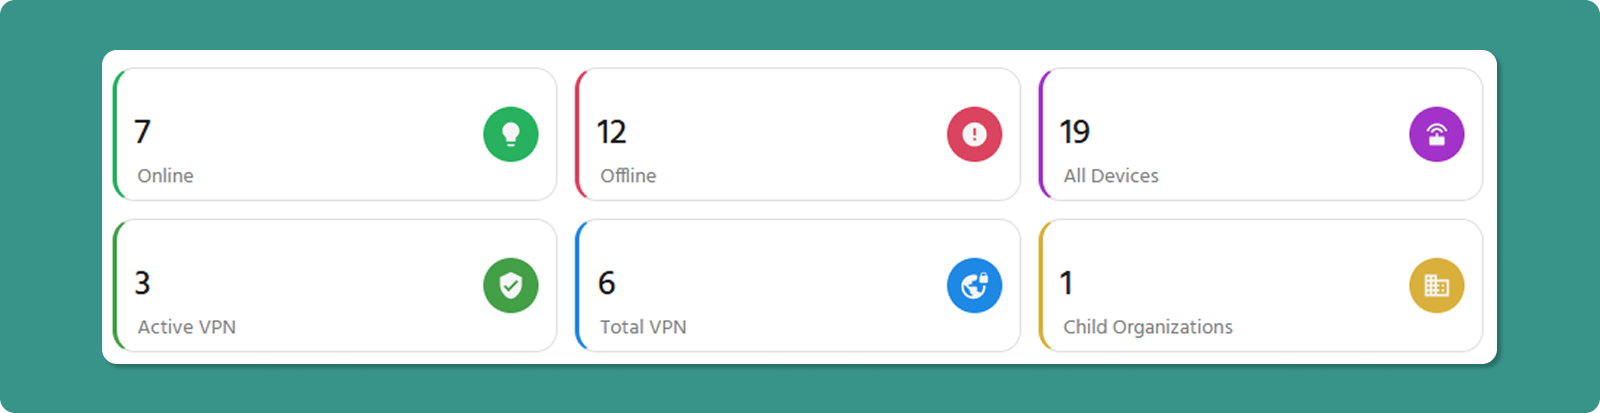
The foursix summary cards at the top display real-time datametrics for your organization and its immediate child organizations (1 level below):.
Card Breakdown
1. Online Devices
-
Online:Displays: Number of devices currently online. -
Offline:Scope: Your organization + direct child organizations only
2. Offline Devices
Displays: Number of devices currently offline.
AllCommon Devices:Reasons: TotalDevice numberpowered ofoff, devicesnetwork registeredissues, underor your organization and its direct child organizations.maintenance
ChildAction: Organizations:Click Thethrough numberto ofDevice List to investigate specific offline devices
Scope: Your organization + direct child organizations created under your organization.only
3. All Devices
Displays: Total registered devices under your management
Calculation: Online + Offline devices
Scope: Your organization + direct child organizations only
4. Active VPN
Displays: Number of active VPN Tunnels currently running
Scope: Your organization + direct child organizations only
5. Total VPN
Displays: Number of total VPN Tunnels
Calculation: Running + Exited
Scope: Your organization + direct child organizations only
4. Child Organizations
Displays: Count of immediate child organizations
Example:
If ayour Level 1 organizationorg has 3 direct childrenchildren, this shows "3"
Note: Does not count grandchild organizations (Level 2),3)
💡 3Tip: underUse Childthese Organizations.cards for quick health checks. A sudden spike in offline devices may indicate network issues requiring investigation.
🎉
Welcome Card & Key Action

The cardLocated on the right side of the summary section, this card provides a welcome message and a quick actionaccess button:to the most common initial action.

Components
Welcome Message
-
WelcomeBrief introduction to AtraRMS:A brief introduction to thedevice and remote managementRMS platform. -
REGISTERDisplayedDEVICEon(OrangeeveryButton):Click this buttonlogin tonavigate directly to the page forregistering aorient newdeviceon the platform.users
REGISTER
📊DEVICE All DevicesButton (Bar Chart)
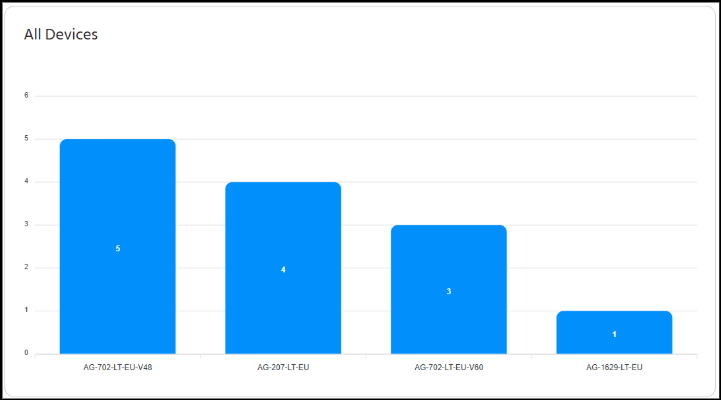
The bar chart on the left displays the total count of all registered devices, grouped by model name (e.g., AG-702-LT-EU-V48, AG-207-LT-EU).Orange)
-
EachPurpose:barrepresents auniqueFast-track devicemodel.registration -
TheAction:numberNavigatesabove each barindicates thetotal countof that model currently registered under yourorganizationand itsdirect child organizations(e.g.,5 for AG-702-LT-EU-V48).
🥧 Online and Offline Devices (Pie Charts)
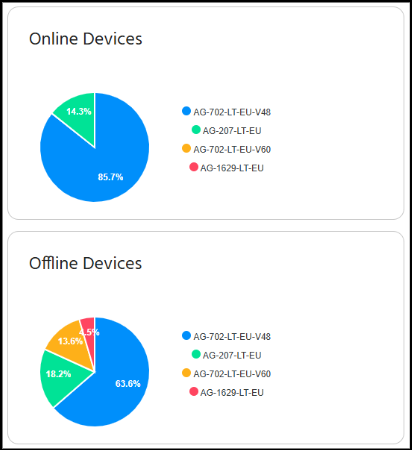
The pie charts on the right break down the overall device status into Online and Offline categories, showing how each device model contributesdirectly to theseDevice statuses.
Online Devices (Top Pie Chart): Displays the percentage of all currently online devices belonging to each registered model.Example: 85.7% of all online devices are of the model AG-702-LT-EU-V48.form
OfflineShortcut: Bypasses Devices (Bottommenu Pie Chart): Displays the percentage of all currently offline devices belonging to each registered model.Example: 63.6% of all offline devices are of the model AG-702-LT-EU-V48.
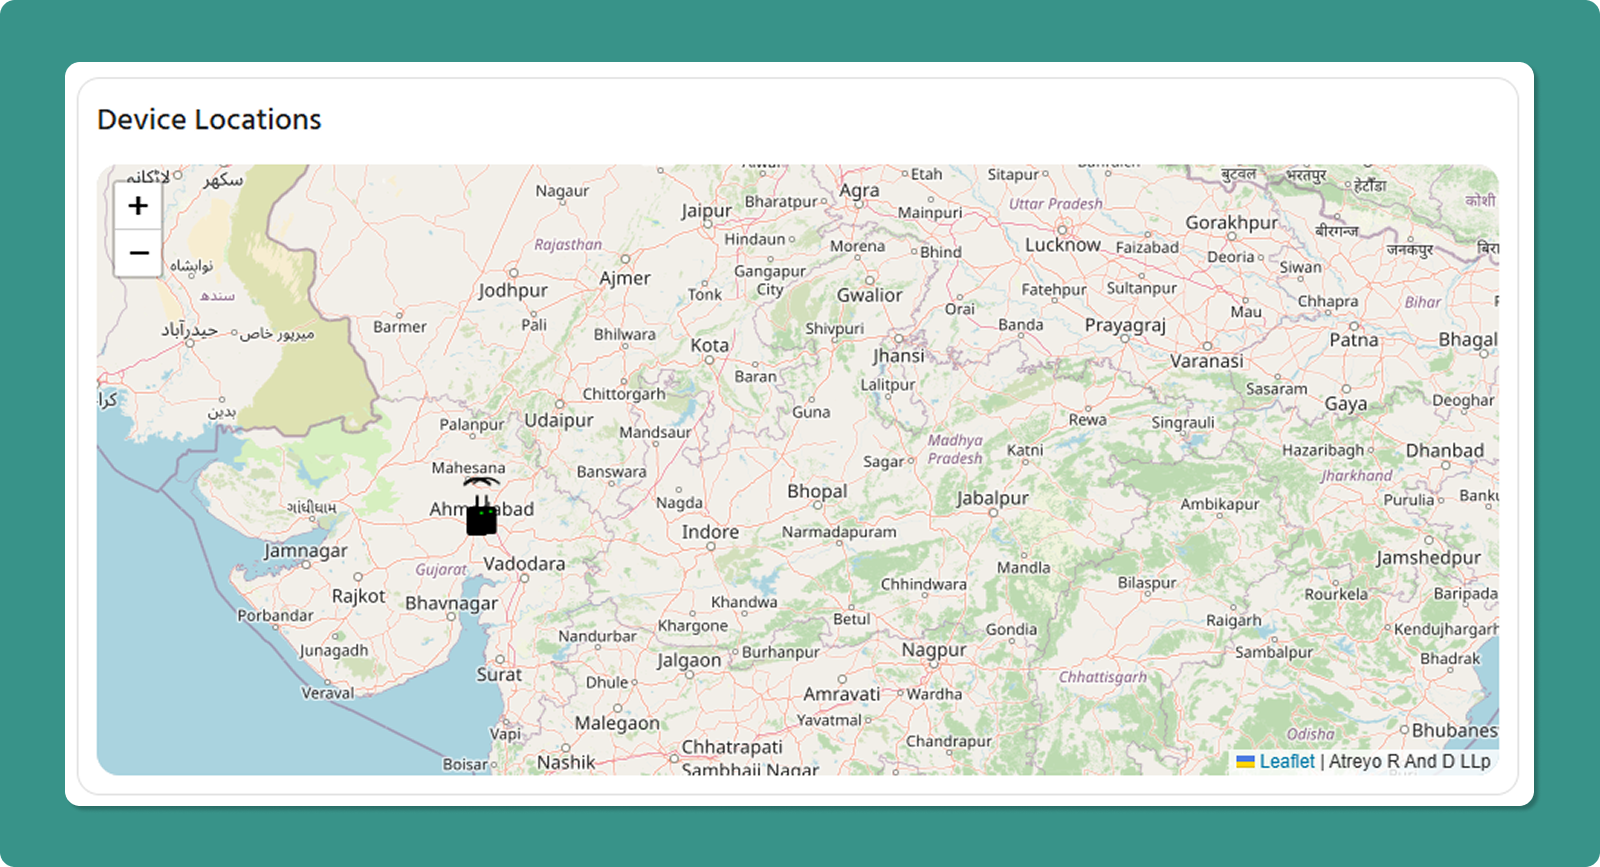
🗺️ Map Functionality

The map displays the physical locations of devices, represented by icons.
Location Source:Devices are shown on the map only if:
The location monitoring service is active on the device and it can fetch a GPS location, ornavigation
The device’s location has been set manually.
Device Status:
A gateway with a Wi-Fi icon and a green dot indicates the device is Online.
A gateway with a warning icon indicates the device is Offline.
Device Information:Hover over a gateway icon (pin) on the mapWhen to viewUse: itsRegistering Serialnew Number.
Zoom Controls (+ / -): Use the plus (+) and minus (-) icons at the top-left cornerGateways to zoom in and zoom out of the map area.
🆕 Recently Registered Devices
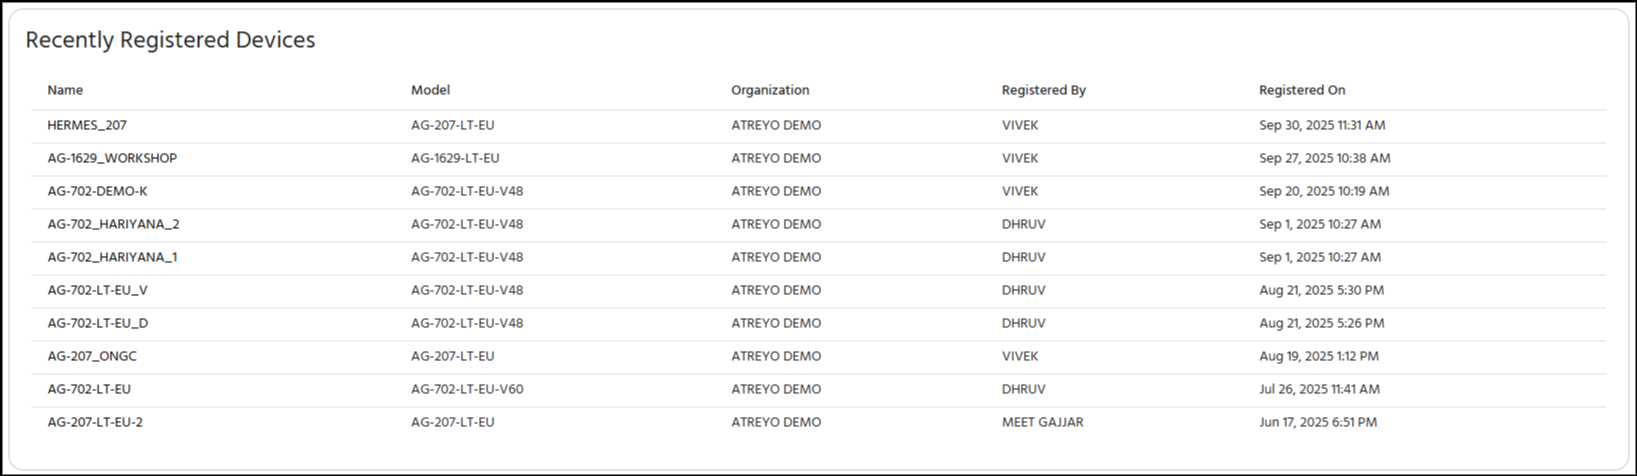
The Recently Registered Devices table provides a quick overview of the last 10 devices registered under your organization and its child organizations.
📋 Device Details
The table displays five key details for each recently registered device:
Name: The unique name assigned to the device (e.g., HERMES_207).
Model: The model name of the device (e.g., AG-207-LT-EU).
Organization: The organization to which the device is currently assigned (e.g., ATREYO DEMO).
Registered By: The user who registered the device (e.g., VIVEK, DHRUV).
Registered On: The date and time when the device was added to Atra-RMS (e.g., Sep 30, 2025, 11:31 AM).
⚙️ Key Action
View Device Profile: Click on a device’s Name in the list to navigate to its detailed profile page.fleet
Device Statistics Charts
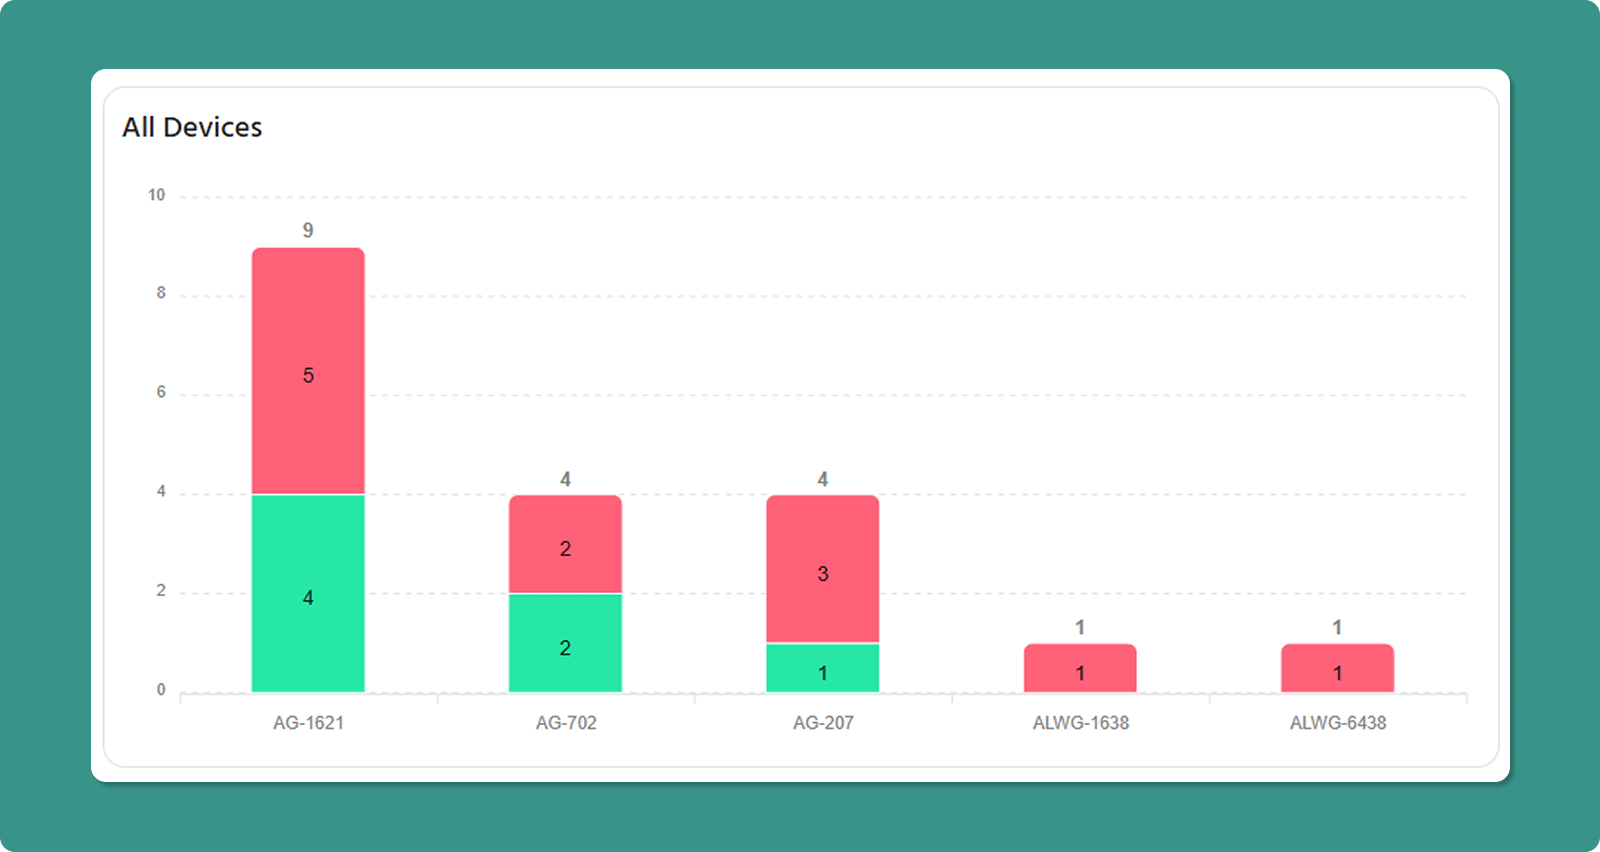
🏢All RecentlyDevices AddedBar ChildChart Organizations(Right Side)
This chart provides a visual breakdown of your online and offline device fleet by model type.
The
Chart AddedElements:
X-Axis: Device model names (e.g., AG-702-LT-EU-V48, AG-207-LT-EU)
Y-Axis: Total device count
Bar Values: Displays the total count of online and offline devices above each bar. Numbers in the green section indicate the online device count, while numbers in the red section indicate the offline device count.
Scope: Your organization + direct child organizations
Use Cases:
Activity Status: View ratios of Online vs. Offline devices across your entire fleet.
Device Status Activity (Left side)
This list provides a quick summarysnapshot of the lastmost 5recent childconnectivity organizationsevents, createdhighlighting underexactly yourhow organization.long ago a device moved to its current Online or Offline state.
📋 Organization Details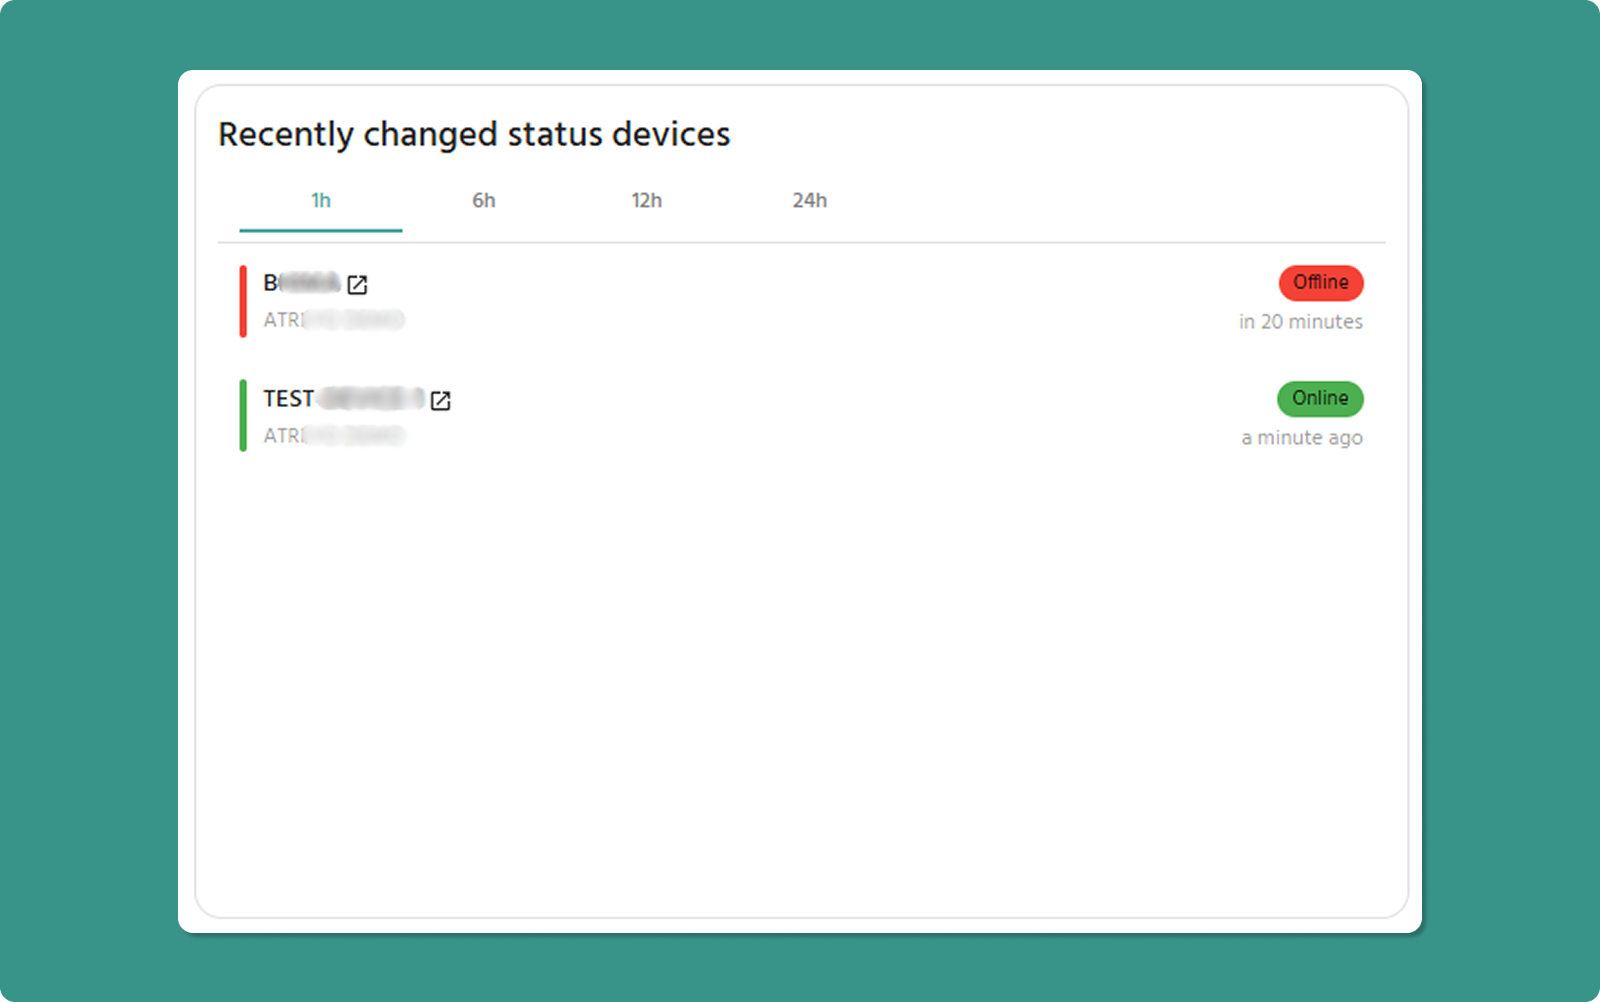
TheCard list displays the following key information for each organization:Elements:
-
Device Name: The specific identifier/name of the device.
Organization: The organization or child organization the device belongs to.
Status: A color-coded indicator showing the current state (Online/Green or Offline/Red).
Status Changed Time: Displays the relative or absolute time the device last switched status (e.g., "Online since 1 hour ago" or "Offline since 6 hours ago").
Time Filters: Quick-toggle options to filter events within the last 1, 6, 12, or 24 hours.
Scope: Your organization + direct child organizations.
Use Cases:
Connectivity Troubleshooting: Identify devices that have recently dropped offline to prioritize immediate maintenance or remote restarts.
Stability Monitoring: Observe if specific organizations are experiencing frequent "flapping" (devices repeatedly cycling between online and offline).
Deployment Validation: Confirm that newly installed devices have successfully reached an "Online" status within the expected timeframe.
Map Functionality
The interactive map displays geographic locations of your device fleet.
Location Data Sources
Devices appear on the map only when location data is available from:
GPS Service (Automatic)
Device fetches GPS coordinates
Manual Entry
The User sets fixed coordinates
Stored in cloud only (not on device)
Useful for stationary installations without GPS
⚠️ Important: If neither source is active, the device will not appear on the map, even if online.
Device Status Indicators
Online Device Icon:
Gateway symbol with Wi-Fi icon
Green dot indicator
Hover to see Serial Number
Offline Device Icon:
Gateway symbol with warning/alert icon
Hover to see Serial Number
Map Navigation
Zoom Controls:
Plus (+) Button: Zoom in for detailed view
Minus (-) Button: Zoom out for broader overview
Location: Top-left corner of map
Mouse Wheel: Alternative zoom method (if supported)
Pan/Drag:
Click and hold to drag map
Reposition view to focus on specific regions
💡 Pro Tip: Use the map for quick visual confirmation that devices are deployed in expected locations.
Currently Connected Users (Right side)
This card displays a view of all users currently connected to the VPN tunnel via the Atra VPN Client.
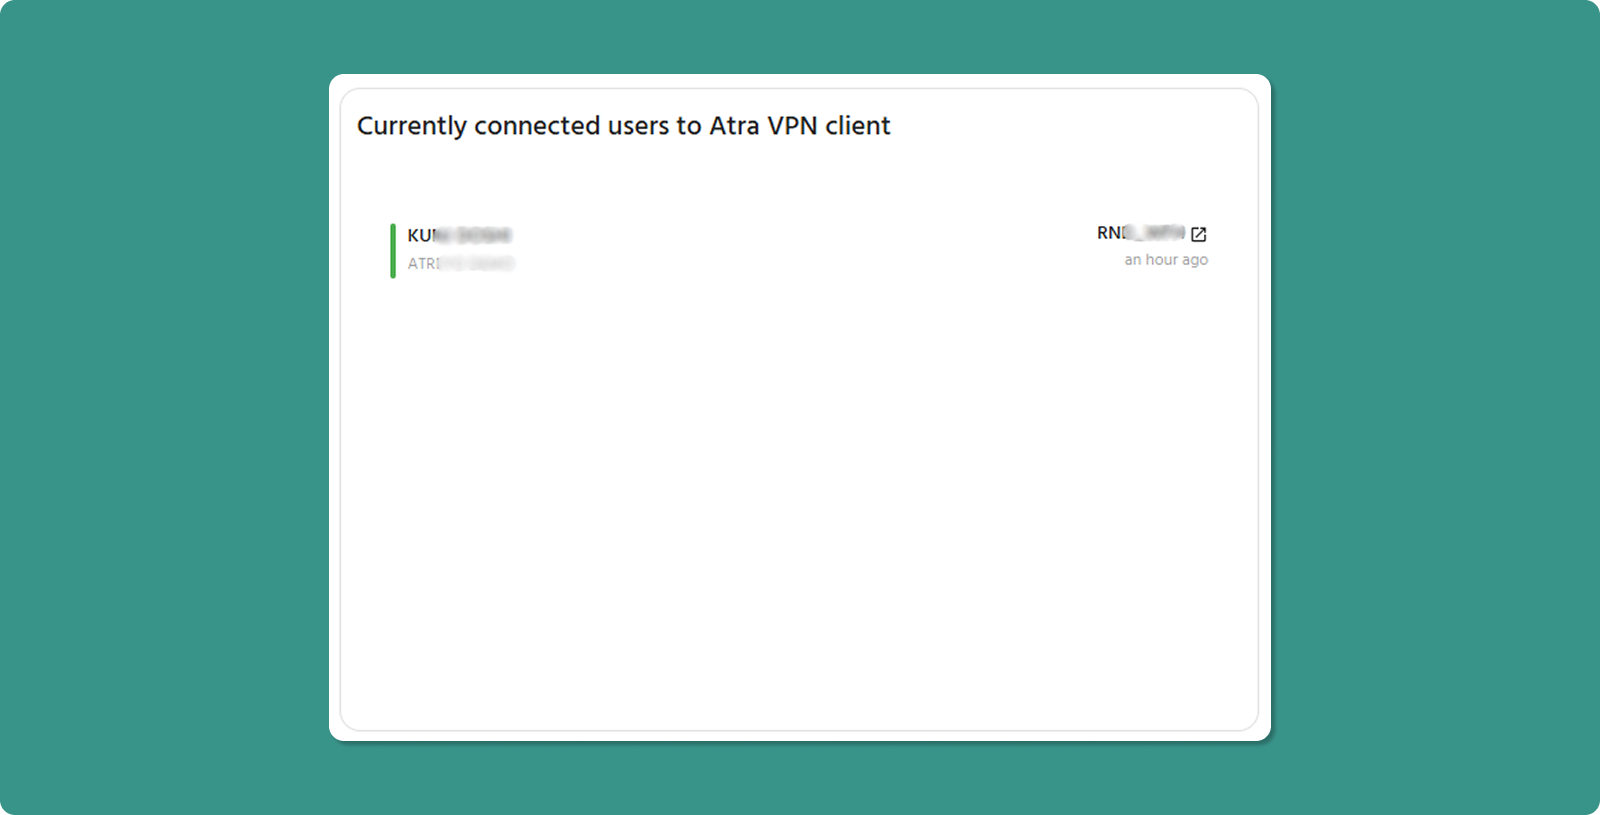
Card Elements:
User Name: The identity of the user currently connected.
Organization: The name of the recently created child organization (e.g.,with DEMO_1,which TESTthe ORGANIZATIONuser 1).is associated.
CreatedVPN On:Tunnel Name: The datename andof timethe VPN tunnel to which the user is connected.
Connected Time: The specific timestamp when the organizationuser wasestablished created.the connection to the VPN tunnel.
Scope: Your organization + direct child organizations.
Use Cases:
Gain instant visibility into how many users are actively working via VPN at any given moment.
See which VPN tunnels are most heavily utilized by tracking the distribution of active users across available tunnels.
Note: This card will only be displayed if a user is connected; otherwise, the map will be shown in full width.
Recent Activity Tables
🧭Recently Registered Devices
This table shows the last 10 devices added to your system, providing a quick view of new devices onboarding.
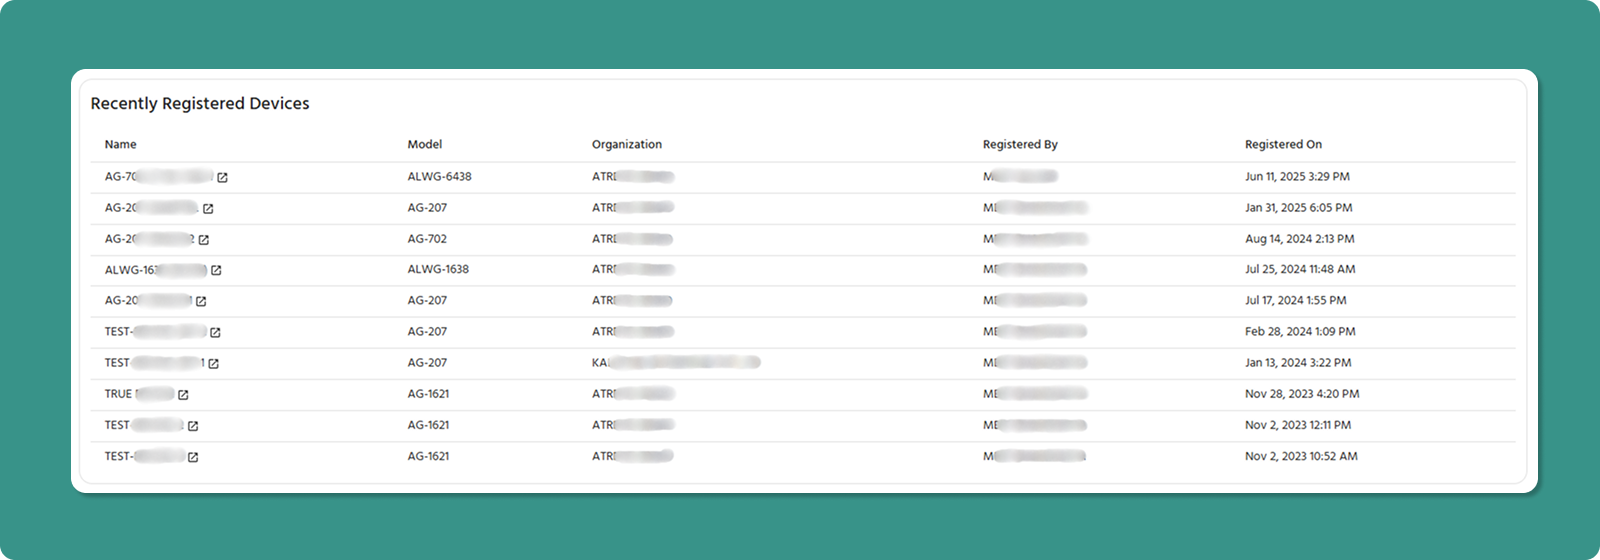
Column
Information
Name
Custom device identifier
Model
Gateway model name
Organization
Assigned organizational name
Registered By
User who registered the device
Registered On
Date and time of registration
Key Action:
Click device Name → Opens full Device Detail Page for monitoring
Common Uses:
Verify recent device additions were processed correctly
Identify who registered devices
Recently Added Child Organizations
This list shows the last 5 child organizations created.

Column
Information
Name
Child organization identifier
Created On
Date and time of creation
Common Uses:
Verify that new organizations were created correctly
Device Count by Organization (Treemap)
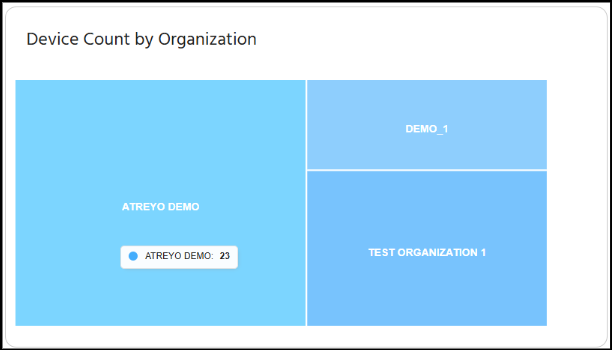
The Device Count by Organization treemap visuallyprovides representsan theintuitive distributionvisual representation of devicesdevice distribution across your currentorganizational organization and its direct child organizations.hierarchy.
🎯 Purpose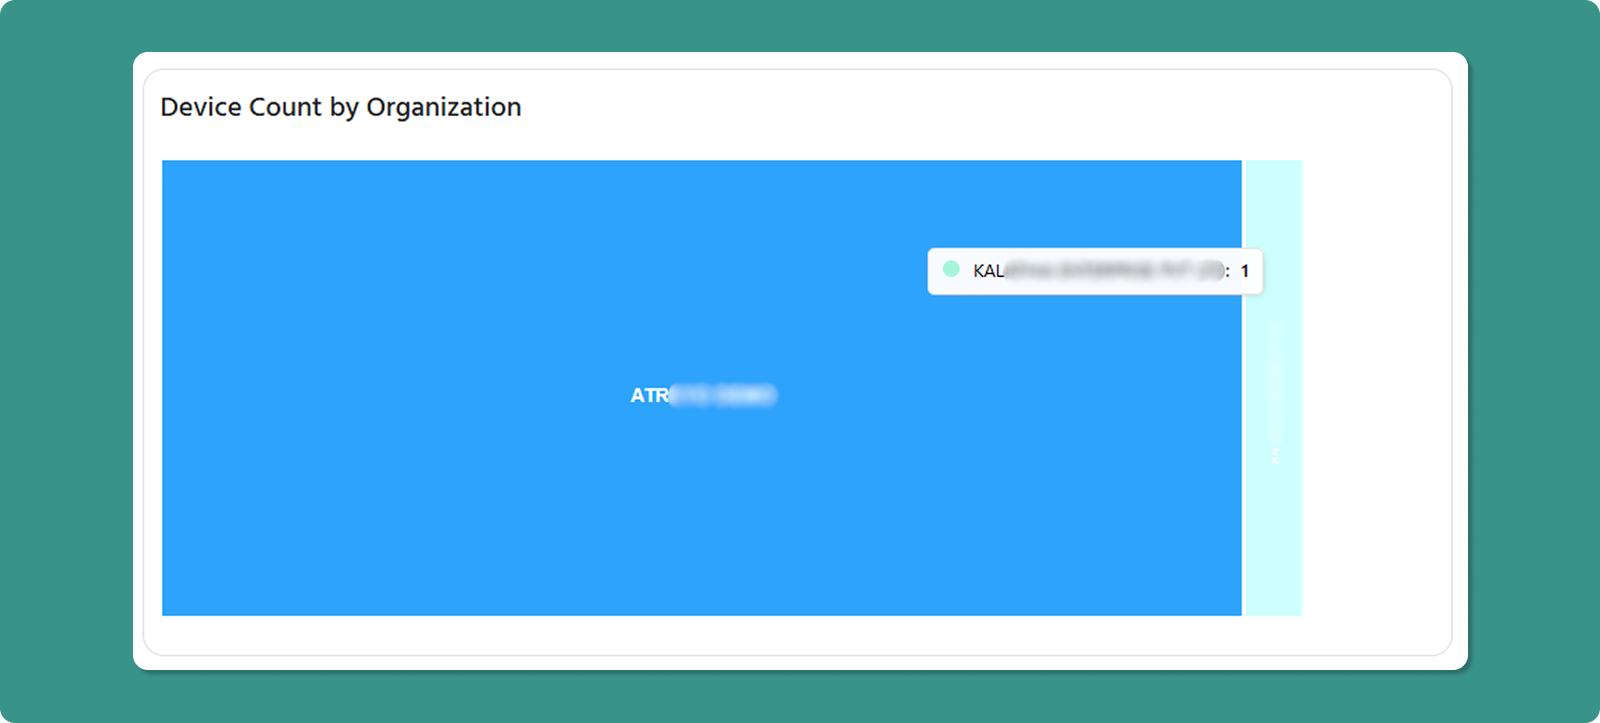
The treemap uses
Understanding the sizeTreemap
Visual each rectangular area to represent the relative number of devices within each organization.Encoding:
-
LargerRectanglerectanglesSize:indicateProportionalahigherto number ofregistereddevices in that organization
Larger Rectangle: More devices. assigned
Smaller Rectangle: Fewer devices assigned
📊 Data DisplayDisplay:
-
Organization
Area:Label:EachName visible inside each rectanglerepresents asingle organization(e.g.,ATREYO DEMO,DEMO_1,TEST ORGANIZATION 1). -
Device Count:overTooltip:anShowsorganization’s area (e.g., the tooltip forATREYO DEMO) to view theexactnumberdeviceof devicesregistered under that organization.count -
Color: Each organization has a distinct color
Important Note:Scope TheNote
⚠️ shownCritical representsUnderstanding:
Each therectangle shows ONLY devices registered directly to that specific organizationorganization. — itIt does notNOT include devices from its child organizations.organizations Eachbelow childit.
Example:
ATREYO separate(Level area1): and50 countdevices withinregistered thedirectly
DEMO_1 (Level 2 child): 30 devices registered directly
Treemap shows: ATREYO = 50, DEMO_1 = 30 (NOT 80)